Which one outperforms? AVAX KSM SOL ATOMInteresting to see how similar these charts all are.. taking bets.. which will outperform in the short term? My bet is on SOL, just based off a hierarchy of the risk-curve, and it being a higher cap project, thus more visible, and considered a lower risk trade than the others.
Avalanche

The first wave is done at 18.5, what nextOn 2H TF
BINANCE:AVAXUSDT has completed the first impulse wave at 18.5 and moving up to 23, right now.
Avalanche needs to test at 18.15 before rally. That level for catching with stoploss below 16.9
Besides, AVAX's a resistance based on trend line at 21.6
What next, wait and see

AVAXUSD Daily TA BullishAVAXUSD Daily bullish. Recommended ratio: 95% AVAX, 5% Cash. *A technical relief rally is underway for cryptos and equities as markets seem to have priced in more rate hikes, I know I focus solely on the Federal Reserve in most of my TA but that's because not only do they fund liquidity for many other central banks but they have been instrumental in setting the tone for the rest of the world for the past decade or more. The Fed was the first central bank to aggressively raise rates in response to global inflationary pressures and in doing so may have earned back a bit of the credibility they lost in being largely responsible for this inflation quagmire. Crypto and equity markets seem to think that the Fed has a plan to navigate us to a soft landing, but it is becoming more and more apparent that a hard landing is likely; when that will be priced in to risk-on markets is the question. Whatever the answer to that question is, we are 'technically' getting close to a short term bottom.* Price is currently following that of other altcoins like Kava and Polygon and trending up out of an eleven day consolidation out of the second largest supply/demand zone on the chart. Volume remains Moderate, fairly balanced between buyers and sellers (indicative of consolidation) and has been shrinking for what is on track to be a fourth consecutive session (indicative of an impending breakout/breakdown). Parabolic SAR flips bearish at $13.80, this margin is neutral at the moment. RSI is currently trending up at 39 after bouncing off of the descending trendline from August 2021 (breaking out of a 10 month descending trend), this is very bullish in the short term. Stochastic remains bullish and is currently trending up at 88 as it aims to resist a bearish crossover on its way to retest max top. MACD remains bullish and is currently trending up at -3.66 as it aims to break out above -4.23 resistance after being rejected the first time on 06/10/22. ADX is currently trending down at 40 as Price is pushing higher, this is mildly bullish at the moment. If Price continues up then it will likely retest the largest supply/demand zone on the chart at $25 before potentially retesting the upper trendline of the descending channel from November 2021 at ~$35. However, if Price breaks down here, it will likely retest the lower trendline of the descending channel from November 2021 at ~$10. Mental Stop Loss: (one close below) $15.

Avalanche Bullish RSI Divergence I think Avalanche will at worst case bottom at 9$. I have started accumulating small positions from 15$ and downwards, will average down and HODL for few months :)

$avax wave clooking for wave c over the next few days. htf avax has been strong compared to majors like btc and eth, so will cut early if necessary.
wave c should be roughly equivalent to wave a.
looking for sub $15.

AVALANCHE (AVAX) the last chance (bottom) and the range market Hello 🐋
Based on the chart, the price is close to the channel support and the major support (bottom) or better to say the previous zone that started its amazing pump to the upside ✔️
if
the price breaks the resistance area to the upside, we will see more gain besides the range market is acceptable scenario too 📖💡🚀
and
if the price break the rang area to the upside, we will see more pump 🚀
Please, feel free to share your point of view, write it in the comments below, thanks 🐋

#AVAX, bearish wave will be kept.#AVAX/USDT 3Day Candle
#AVAX is one of the hyped coin in 2020 ~ 2021 bullish wave.
It's returning its gain, and price is lean towards to weekly support levels, $9 ~ 10 and $4 ~ $5.
There are imbalance zone at the $4 ~ $9, price will tends to fill this imbalance zone.
As bullish wave was kept long time bearish wave has to be long.
This bearish wave can be ended when price reaches $3 ~ $4 weekly support and fills the imbalance zone.

AVAX Avalanche: Monthly ChartHello friends, today you can review the technical analysis idea on a 1M linear scale chart for Avalanche ( AVAXUSDT ).
The chart is self-explanatory. With the crypto market going through a correction, AVAX may still have downside to go. See where I believe there may be strong support and possible bottom.
Included in the chart: Trend line, Support and Resistance Lines, and Volume.
If you enjoy my ideas, feel free to like it and drop in a comment. I love reading your comments below. More ideas below!
Disclosure: This is just my opinion and not any type of financial advice. I enjoy charting and discussing technical analysis. Don't trade based on my advice. Do your own research! #cryptopickk

Avalanche longAvalanche bounced off the support level. Asset broke trough off the descending trendline. Bullish movement to resistance level at 23 is possible.

AVAX finds support at $18, can the bulls defend the level?The Avalanche price analysis shows that AVAX has finally found support at the $18.00 mark, which has caused significant bearish pressure to subside. However, it is unlikely that the asset would show a sharp recovery since the trading activity remains low across the short term.
The broader cryptocurrency market observed a bearish market sentiment over the last 24-hours as most major cryptocurrencies record negative price movements. Major players include BNB and ETH observing an 8.99 and an 8.04 percent decline, respectively.
The MACD is currently bearish, as expressed in the red color of the histogram. Moreover, the indicator shows strong bearish momentum as observed in the high depth of the histogram. Furthermore, the indicator’s lighter shade suggests an increasing bearish momentum as the price action finds support around the $18.00 mark.
The EMAs are currently trading below the mean position as net price movement over the last five days remains negative. However, as the AVAX market turned sharply bearish, the EMAs have started moving downwards, with the 12-EMA taking the lead. At press time, the 12-EMA is diverging sharply from the 26-EMA as selling activity increased in recent hours.
The RSI was trading in the neutral zone since 30 May as the price volatility for Avalanche dwindled across the short-term charts. However, yesterday the indicator dived into the oversold region as. The indicator is currently moving upwards as the price action finds support at the $18.00 mark. However, strong bearish pressure still weighs on AVAX markets.
The Bollinger Bands were narrow until June 10 but then exhibited sharp divergence as the price action observed sharp volatility. Currently, the indicator is still expanding to facilitate the sharp bearish activity. At press time, the lower limit provides support at the $18.02 mark while the mean line presents resistance at the $22.32 mark.

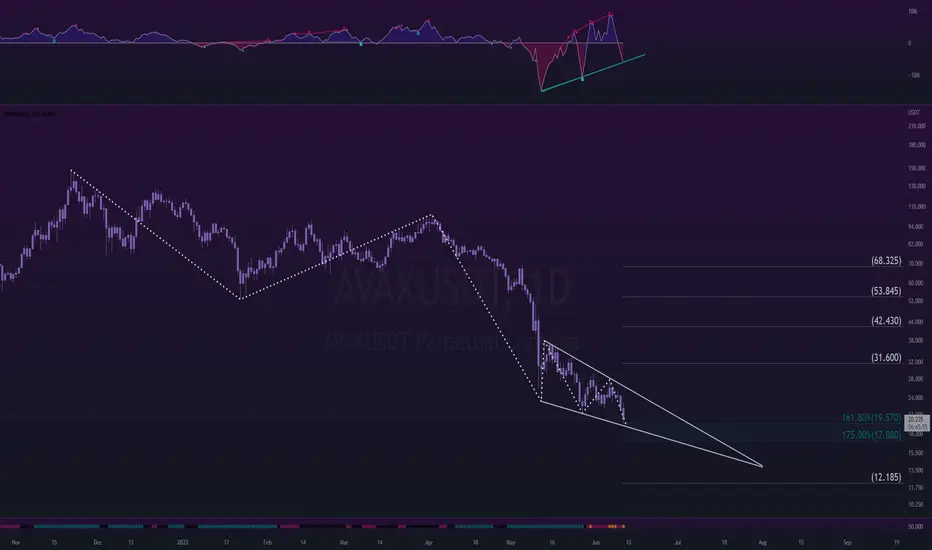
When AVAX cryptocurrency do it x2 growth ?Today, on the global chart AVAXusdt, consider how this trading pair endured another sharp fall in May.
To begin with, let's take a look at our previous global idea for a pair of AVAXusd, which we did exactly 3 months ago.
At that time, we made an approximation with longs buy zones
As it turned out 3 months later, our most pessimistic $40-45 purchase zone at the top of the red liquidity zone was not the bottom of the decline.
Fall lows are recorded at around $23, at the bottom of liquidity zone, in which a year ago for a long time decided who is stronger: buyers or sellers.
Keeping buyers in the coming days of the AVAX price above the mark of $30 will be a good signal to go to the long.
The purpose of fixing longs in the up liquidity zone is $64-81
If the price of the Avalanche token is fixed below $26 , it will most likely coincide with continue the global decline in the cryptocurrency market. In this situation, it is necessary to place "buckets" for the purchase of AVAXUSDT near 14 dollars.
_______________________________
Since 2016 , we have been analyzing and trading the cryptocurrency market.
We transform our knowledge, trading moods and experience into ideas. Each "like under the idea" boosts the level of our happiness by 0.05%. If we help you to be calmer and richer — help us to be happier :)

avalanchesome nice bullish divergence on avalanche, daily timeframe.
falling wedge, indicative of a reversal in the near future.
it might just be a bear market rally, before continued downside - so exercise proper risk management if you play anything in the land of crypto.
---
take profit targets are on the charts, it likely will only get to the first or second, but it can technically go all the way if the market condition allows for it to happen.
Avalanche AVAX short Entry Range, Take Profits and Stop LossLast AVAX short
AVAX/USDT short
Entry Range: $21 - 23.30
Take Profit 1: $17
Take Profit 2: $13
Take Profit 3: $9
Stop Loss: $27.50

Avalanche AVAX Price Targets and Stop LossAVAX/USDT short
Entry Range: $90.50 - 98.70
Take Profit 1: $84.80
Take Profit 2: $73.30
Take Profit 3: $67.45
Stop Loss: $104.40

🎯AVAX: the buyers are here! Are they ready to pump the price?Avalanche is going to break the trendline.
📊Why is long possible:
1. you can see lot`s of buyers at the volume indicator. At least 3 times they hold the price and push it up. The value area of $23-25 become a strong support for the price.
2. AVAX in going to return to the $26.6-27.8 value area. For the 3rd time price try to break this level, so it`s highly possible because it shows the buyer presure.
3. trendline squeese is the additional confirmation for the breakout.
🚩Targets:
🔶1. $26.6-28 - closest value area and resistance for the price, but this area with 3rd test became weaker and weaker
🔶2. $32-34 - huge value area
💻Friends, press the "like"👍 button, write comments and share with your friends - it will be the best THANK YOU.
P.S. Personally, I open an entry if the price shows it according to my strategy.
Always do your analysis before making a trade.

Avalanche longAvalanche bounced off the support area. Asset bounced off the ascending trendline. Bullish movement to resistance level at 27.6 is expected to happen.

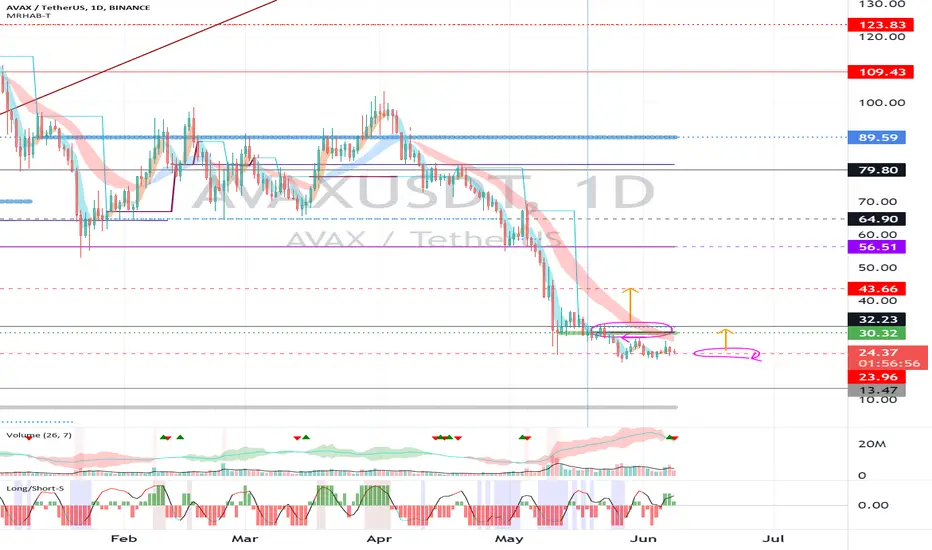
Avalanche (AVAX) - June 9hello?
Traders, welcome.
By "following", you can always get new information quickly.
Please also click "Like".
Have a good day.
-------------------------------------
(AVAXUSDT 1W Chart)
Below 32.23 is likely to be a mid- to long-term investment area, so careful trading is required.
So, whether it can move higher than 32.23 is the key question.
(1D chart)
Whether we can find support at 23.96 and move above 32.23 will be the key.
If it moves above 30.32, I expect it to turn into an uptrend in the short and medium term.
(buy)
- After confirming the support in 32.23
(Stop Loss)
- When it falls below 30.32 and receives resistance
- When it falls below 23.96
(Sell)
- When receiving resistance in the section 56.51-64.90
- When receiving resistance in the range 79.80-89.59
If it rises above 89.59, it is expected to surge.
------------------------------------------------------------ -------------------------------------------
** All indicators are lagging indicators.
Therefore, it is important to be aware that the indicator will move accordingly as price and volume move.
However, for the sake of convenience, we are talking in reverse for the interpretation of the indicator.
** The MRHAB-T indicator used in the chart is an indicator of our channel that has not been released yet.
** The OBV indicator was re-created by applying a formula to the DepthHouse Trading indicator, an indicator disclosed by oh92. (Thanks for this.)
** Support or resistance is based on the closing price of the 1D chart.
** All descriptions are for reference only and do not guarantee a profit or loss in investment.
(Short-term Stop Loss can be said to be a point where profit and loss can be preserved or additional entry can be made through split trading. It is a short-term investment perspective.)
---------------------------------
AVAX LONGAvax Bounced of the 21$ resistance.
Expecting a retest of the Support. If we stay above it after the retest and break above the downtrend line,will be a good buy signal.
MACD is in positive momentum and RSI looks positive too and close to oversold.
Our First Target will be below the Major resistance of 51$ and the Second at 38.2% FIB retracement near 70$.

AvalancheAvalanche has a chance to recover!
The steady demand for the Avalanche coin allowed a short-term trend to form and come close to the resistance level of $30 per coin. $30 resistance is a key area for continued growth, where a lot of pent-up investor demand can be concentrated, which will increase momentum. Steady growing demand from the $30 support level is able to form a medium-term trend with the aim of testing the $40 levels and the subsequent $60 levels, which is the key level and the point of intersection of the trend line of the long-term descending channel within which the coin is located after updating its high level of $145 per coin.

AVAX usdt - $28 resistance was supportThe $28 resistance on the 1 & 4 hour charts shows a tough barrier to break.
The Resistance being the former support level.
If Avax can breach this resistance we will see a return to this price as support.

Avalanche (AVAX) formed big Gartley for upto 3770% huge moveHi dear patrons, hope you are well and welcome to the new trade setup of Avalanche (AVAX).
Previously we had a nice trade of AVAX:
Now on a monthly time frame, AVAX has formed bullish Gartley pattern.
Note: Above idea is for educational purpose only. It is advised to diversify and strictly follow the stop loss, and don't get stuck with trade

AVAX 1H BUYAVAX 1H support is at ~$26
Enter 50% at the current price
and try to set some buy orders near the support zone
If AVAX holds above the trendline,
the Take-Profit target would be 5%, 10%, and 15% from your entry
Cheers

Avalanche - Short Term Swing Trading Idea - 29 May 2022FTX:AVAXUSD for a few days dropped over 35% and on bigger time frames start forming good price action upwards. In the next 3-4 days I expect gains of over 30% and hit a strong resistance level of over $31 per coin.
What is the supported thesis technically for the expected scenario on Avalanche?
- Price-action will be a strong signal in the next couple of hours
- By Elliot waves - there are 5 waves impulse and expecting classic A-B-C correction
- The RSI indicator will hit a bit lower before curving up
If you have any questions related to this trading idea I will be happy to provide you with answers. FTX:AVAXUSD
