Avalanche corrected from resistance ┆ HolderStatBINANCE:AVAXUSDT broke below $27.6 and is testing $25.9. Breakdown may open $24.5. Bears remain in control.
Avax
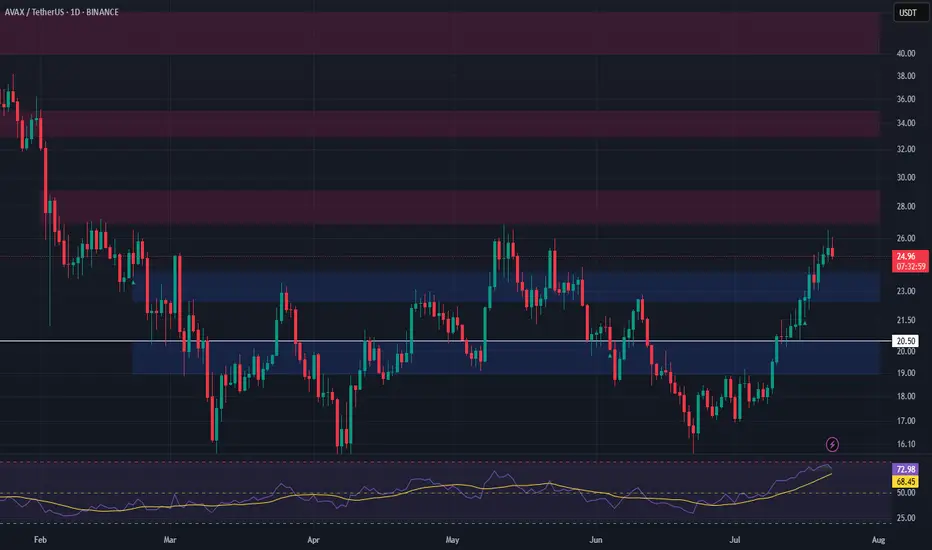
AVAX Long Swing Setup – Waiting for Support RetestAVAX has been rallying for two straight weeks, showing strong momentum. We’re watching for a healthy pullback into the $22.50–$24.00 support zone to position for continuation. If this zone holds, the risk/reward setup favors bulls with clear upside targets.
📌 Trade Setup:
• Entry Zone: $22.50 – $24.00
• Take Profit Targets:
o 🥇 $27 – $29
o 🥈 $33 – $35
o 🥉 $40 – $44
• Stop Loss: Daily close below $20.50
AVAX/USDT Trade Setup: Bullish Bias with Fibonacci Targets🚀 AVAX/USDT Avalanche is currently in a strong bullish trend 🔼. On the 4H chart, price is pulling back slightly 📉, and I’m watching for momentum to pick up and break above the current range high 📊—that’s where I’ll be looking for the next entry.
🎯 My bias remains long, and in the video I break everything down in detail:
🔍 Price action
🧱 Market structure
📈 Overall trend
📍 Stop loss placement (below the previous swing low)
🎯 Targeting key Fibonacci levels
I also go over my exact Fibonacci settings and how I use them to frame the trade.
This is not financial advice ❌💼

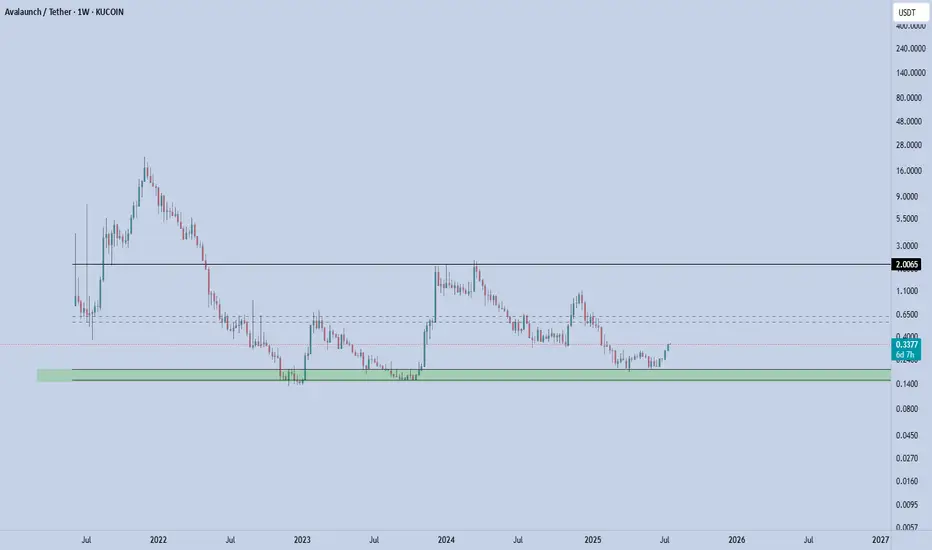
XAVA - Rebound in Play XAVA coin is currently stabilizing in a key support zone — the bottom of the defined channel, which has proven to be a strong and reliable support area. Price recently bounced from this level, confirming buyer interest.
From here, the next immediate target is the mid-range of the channel. If price manages to break above and hold the mid-channel, the next upside objective becomes the top of the channel.
Key Levels
Support (Channel Low): 0.15(invalidation below this level)
First Target (Mid-Channel): 0.56-0.62
Second Target (Channel High): 2
📌 Risk Management: A clean break below 0.15 invalidates this setup. As long as this level holds, the structure remains constructive and favors rotation toward higher levels within the channel.
Avax Tests Key Resistance at 27 for the Third TimeAvax is once again testing the 27 resistance level. The first attempt lasted over a week, and the second one held for a couple of days, but in both cases, Avax failed to break through. This time, however, it has stronger support from market-wide momentum.
Bitcoin has reached 120,000, Ethereum is posting sharp gains, and most notably, Chainlink (LINK) has already broken through its own resistance. Avax and LINK have shown a high degree of correlation, nearly 89% over the past two months. This strong relationship, while occasionally fluctuating, has been in place for several years.
A breakout for Avax may take time, but it now has more momentum and supportive conditions behind it. Still, as long as the 27 resistance holds, bulls should approach with caution before entering long positions.
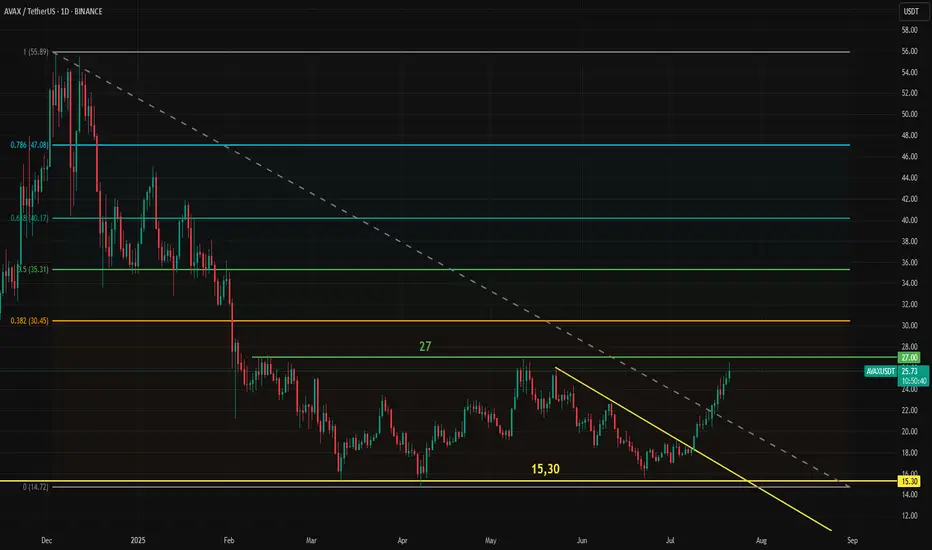
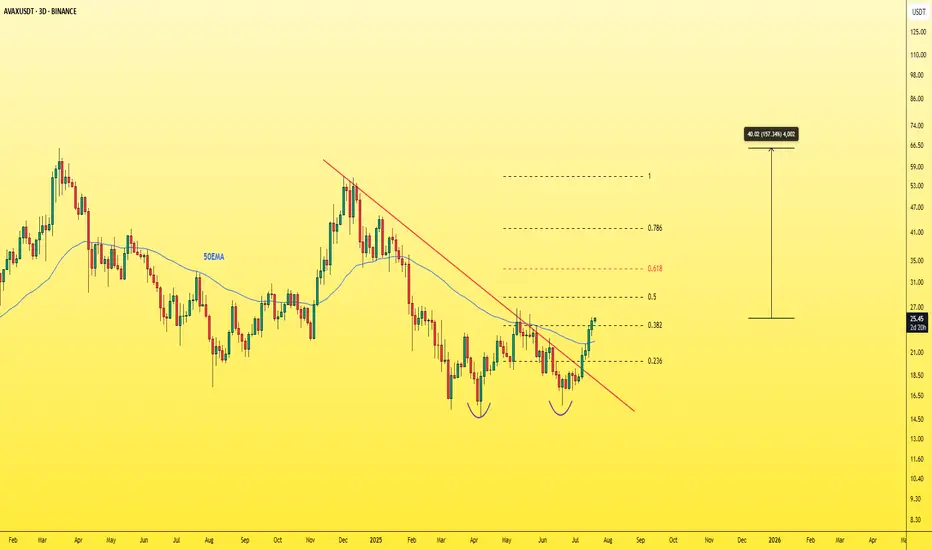
AVAXUSDT - THE real treasure must be hunted!Let's not forget about CRYPTOCAP:AVAX — it's one of the must-have assets in any crypto portfolio.
Currently trading at a discounted price after dropping from its previous top at $55, AVAX now shows strong bullish potential with plenty of upside ahead.
🚀 Key bullish signs:
-Successfully broke through multiple resistance levels, including the 0.382 Fibonacci retracement, 50 EMA, and the main descending trendline.
-A daily close above the 26$ level is a very positive signal.
With a solid project, reliable fundamentals, and low risk compared to potential reward, this could be a highly profitable opportunity.
Don’t sleep on it.🎯
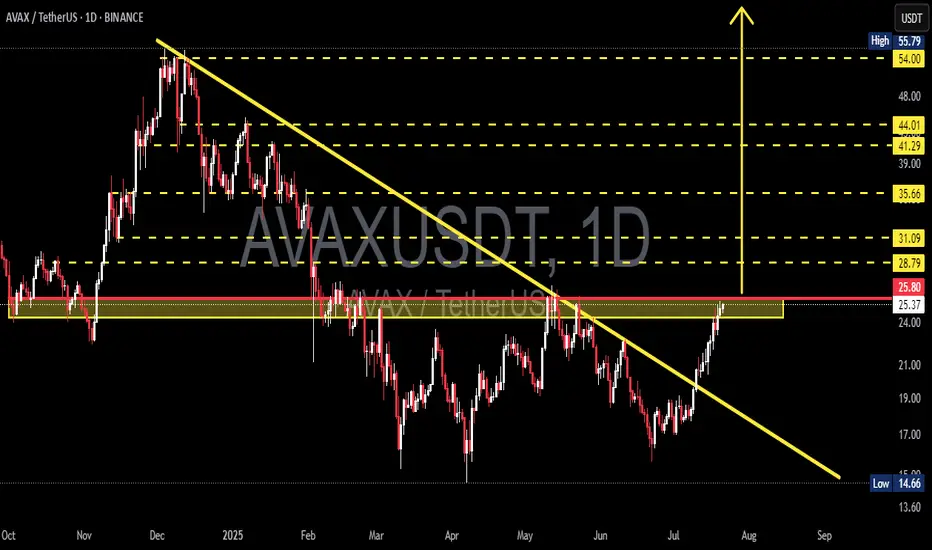
AVAX/USDT Massive Trend Reversal: Breakout from 8-Month DowntrenAVAX has just delivered one of its most technically significant moves in recent months. After spending over 8 months trapped under a descending resistance line, price action has finally broken free — suggesting a potential trend reversal and the beginning of a much larger bullish phase.
🧠 Pattern & Structure Breakdown:
📌 Descending Trendline Breakout
AVAX had been forming a descending triangle pattern, characterized by consistent lower highs and a horizontal support zone between $14.66 – $22. The recent bullish breakout from this structure, accompanied by strong volume, is a highly encouraging sign for bulls.
📌 Accumulation Zone Identified
The yellow zone on the chart ($14.66 – $22) has proven to be a strong demand zone where buyers consistently stepped in. The recent rally originates from this base, indicating possible institutional accumulation.
📌 Critical Horizontal Resistance at $25.80
Price is now testing the $25.80 resistance zone, which historically acted as a supply area. A successful daily close and confirmation above this level would officially flip the structure bullish.
📈 Bullish Scenario – Multi-Level Upside Targets:
If AVAX confirms the breakout above $25.80, these are the key bullish targets ahead:
🎯 Target 1: $28.79 – minor resistance & potential short-term TP zone
🎯 Target 2: $31.09 – previous price equilibrium
🎯 Target 3: $35.66 – key pivot from past market structure
🎯 Target 4: $41.29 and $44.01 – heavy historical supply zones
🎯 Target 5 (measured move): $54.00 to $55.79 – the projected breakout target from the descending triangle pattern
This move would represent a full technical recovery if AVAX aligns with broader market sentiment and Bitcoin remains stable or bullish.
📉 Bearish Scenario – Pullback Risks:
On the flip side, if price fails to sustain above $25.80 and gets rejected:
⚠️ A retest of $24.00 – $22.00 is likely
⚠️ If that zone breaks down, next support lies at $19.00 – $17.00
⚠️ A loss of the $17 level may trigger a return to the critical low near $14.66
This would invalidate the bullish breakout and return AVAX into a sideways or downward consolidation phase.
🔍 Additional Technical Insights:
✅ Volume is steadily increasing — showing renewed buying pressure
✅ Indicators like RSI and MACD (if applied) are likely showing bullish divergence
✅ Overall altcoin sentiment is improving, providing a tailwind for AVAX's potential breakout continuation
🧩 Final Thoughts:
AVAX is at a pivotal moment in its medium-term price structure. The breakout above the long-term downtrend line is a strong technical shift. A confirmed breakout and hold above $25.80 could trigger a multi-week or multi-month rally targeting $40 – $55+.
However, traders should be cautious of possible pullbacks and manage risk accordingly — especially as resistance zones from previous structures are being tested.
#AVAX #AVAXUSDT #CryptoBreakout #TechnicalAnalysis #Altcoins #BullishCrypto #DescendingTriangle #ReversalPattern #AVAXAnalysis
Avalanche's (AVAX) $229 & $363 Bull Market Potential ExposedStarting from the December 2020 low, Avalanche (AVAX) grew a total of 5,245% to its November 2021 all-time high. Now, if we take the true market bottom, when trading started back in September 2020 with a low of $0.85, total growth by the end of the bull market amounts to 17,152%.
It doesn't matter how you slice it, both are incredibly strong numbers.
Do you really think Avalanche will consolidate for years only to grow 500%, 600% in its bull market? I don't think so. This prolonged consolidation period was a test. Those that remained true to the market; those that continued to hold; those that continued to develop, to build and to grow within the market; all those people will be rewarded, big time.
Let's consider the true potential for AVAXUSDT in early 2026 or late 2025.
The main target is $229. I think missing a new all-time high is out of the question. We are going for the top as the market has been growing behind the scenes for so long. So much hard work has gone into making Cryptocurrency accessible to everybody and this hard work is about to pay off.
This $229 target opens up 880%. Keep in mind that this coming from current prices. If we were to consider the bear market bottom, this number would be much higher, something around 2,564%.
The next target, a "strong all-time high," is open at $363. This would give us a total profits potential of 1,450%.
As you can see, Avalanche is trading at bottom prices with plenty of room left available for growth. It is still very early if you focus on the long-term.
Thank you for reading.
Your support is appreciated.
Namaste.

AVAXUSDTWe are bear-trend but wait for break trendline and pollback to 18.50$.
BINANCE:AVAXUSDT
Support: 16.90
Resistance: 18.50 - 21.30 - 25.50
⚠️Control money management.

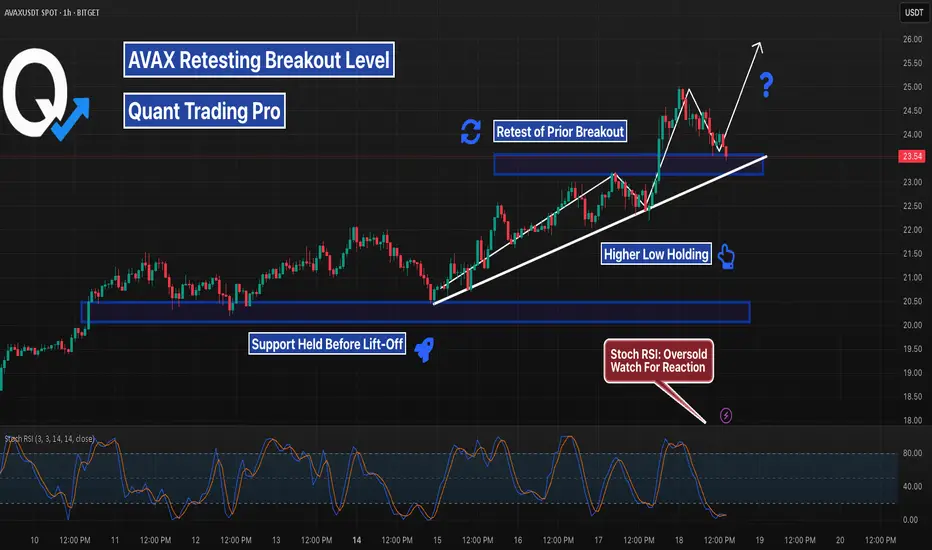
AVAX Backtests Breakout — Bounce Now or Dump Later?AVAX has pulled right back into the same level it broke out from days ago. With Stoch RSI fully oversold, this is a high-probability reaction zone — but if bulls don’t show up, next support sits lower around $21.50. Tight risk, high reward.
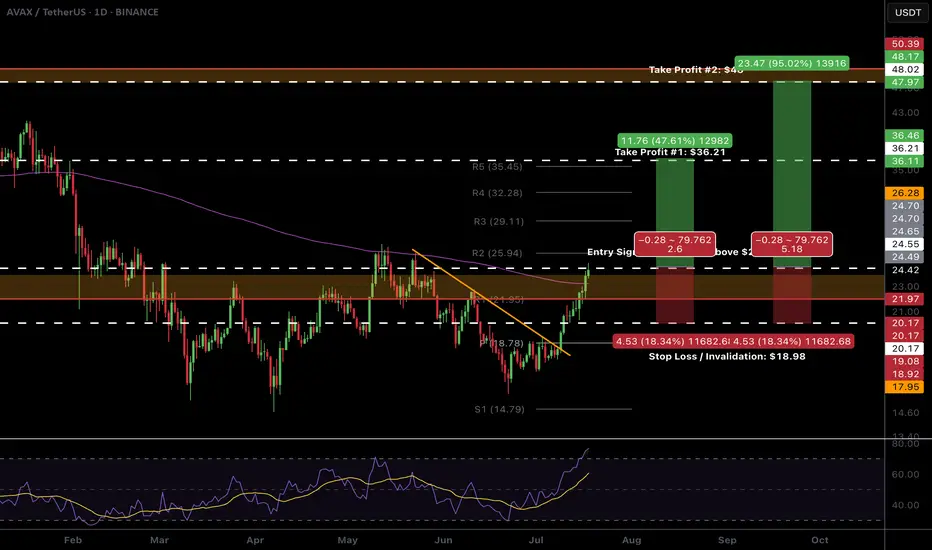
$AVAX Ready to breakout!CRYPTOCAP:AVAX looks ready to pop.
High Volume Node resistance and daily 200EMA is clear and now support. We don't want to see price rejected and moving back below this area.
The R5 daily pivot is my first partial take profit $35-36 followed by the major resistance High Volume Node at $48
Daily RSI is overbought with unconfirmed bearish divergence so watch out for this but should be good to run in the mean time. BTC permitting...
Safe trading
AVAX is Back: Subnets, Upgrades, and Institutional Momentum🚀🧠 AVAX: Subnets, Upgrades, and Institutional Momentum 🔧🏛️
Avalanche (AVAX ) is starting to shape up again — not just on the chart, but at the infrastructure and institutional level too.
As part of the Altcoin Series, I continue to trade these setups while preparing for a time when I’ll divorce alts emotionally and treat them for what they are — assets to be traded, not worshipped.
But right now? This one looks strong.
📊 Chart Breakdown
Left side: Macro chart (8H)
✅ We've just completed a successful third touch of structural support — you can see the 1–2–3 test boxed below the $18.64 level
📍 That’s usually where conviction builds, and reversals are born
🚀 A massive breakout confirmation comes if we close above $22.97 — the level to watch
🧱 Above that, the path opens toward higher fib levels: $27.65 → $35.13 → $43.63 and beyond
Right side: Micro structure (30-min chart)
🔍 A descending wedge or coil forming — typical of consolidation before breakout
This price action is tightening into a decision point, right around $20.80–$21
I expect a breakout soon, with a push toward the macro trigger at $22.97
🧩 What’s New with AVAX?
Avalanche 9000 Upgrade is Live
Major performance overhaul: cheaper subnets, faster deployment
Subnets now act more like sovereign L1s, enhancing utility across the board
Developer cost dropped by over 99%, inviting serious builders
DeFi, Real-World Assets & Ecosystem Growth
TVL > $5B
VanEck’s $100M Treasury Fund now tokenized on Avalanche
Over 515M transactions per month
Real-world integrations with Alipay, California DMV, and more
Enterprise Expansion
FIFA subnet launch (NFTs, tickets, collectibles)
Institutional panels at Avalanche Summit London
Avalanche’s vision: a custom chain for every institution
Retro9000 Grant Program
$40M set aside to fuel L1 growth via subnets
Analysts expect 300% subnet growth by Q4 2025
🧠 The Mindset: Trade, Not Worship
AVAX is a great example of why I'm preparing to divorce altcoins at the cycle top.
It’s gone from hype to silence... and now to real infrastructure momentum.
So yes — I’m bullish.
But I’m not here for belief — I’m here for the structure.
✅ Buy over support
✅ Breakout over $22.97
🛑 Stop-loss if structure fails
🎯 Targets: $27.65 → $35.13 → $43.63+
🏁 Final Word
Avalanche is rebuilding — on-chain, in the real world, and on the chart.
It has subnets, speed, and now institutional backing.
Let’s trade it smart.
Let’s trade it without emotions, do your risk management and don't listen to me.
One Love,
The FXPROFESSOR 💙
Disclosure: I am happy to be part of the Trade Nation's Influencer program and receive a monthly fee for using their TradingView charts in my analysis. Awesome broker, where the trader really comes first! 🌟🤝📈

AVAX – Watching for Support Retest After Resistance TestAVAX is currently testing a major resistance level, and we’re anticipating a potential retrace into support. The $19.00–$20.45 zone offers a strong area to enter a long swing position on confirmation of the retest.
📌 Trade Setup:
• Entry Zone: $19.00 – $20.45
• Take Profit Targets:
o 🥇 $22.50 – $24.00
o 🥈 $27.00 – $30.00
• Stop Loss: Daily close below $18.50
AVAXUSDT – Major Trendline Broken | Targeting Upper RangeAVAX broke out of a long-standing descending trendline and confirmed the breakout with a clean retest.
The previous structure around $20 has now flipped into support.
If momentum holds, bulls could drive price toward $27–$30.
Watching closely for signs of continuation or a fakeout trap.
#AVAXUSDT #Avalanche #Breakout #TrendlineBreak #QuantTradingPro #TradingView

An 8.8:1 risk-to-reward trade setup for AVAX.A small pullback is likely at this point. This setup offers an 8.8:1 risk-to-reward ratio with a target of 50.
Entry at 20.8,
Stop loss at 17.50
Target at 50.

AVAX/USDT - H4 - Wedge Breakout (29.06.2025)The AVAX/USDT pair on the H4 timeframe presents a Potential Buying Opportunity due to a recent Formation of a Wedge Breakout Pattern. This suggests a shift in momentum towards the upside and a higher likelihood of further advances in the coming Days.
Possible Long Trade:
Entry: Consider Entering A Long Position around Trendline Of The Pattern.
Target Levels:
1st Resistance – 21.77
2nd Resistance – 24.35
🎁 Please hit the like button and
🎁 Leave a comment to support for My Post !
Your likes and comments are incredibly motivating and will encourage me to share more analysis with you.
Best Regards, KABHI_TA_TRADING
Thank you.

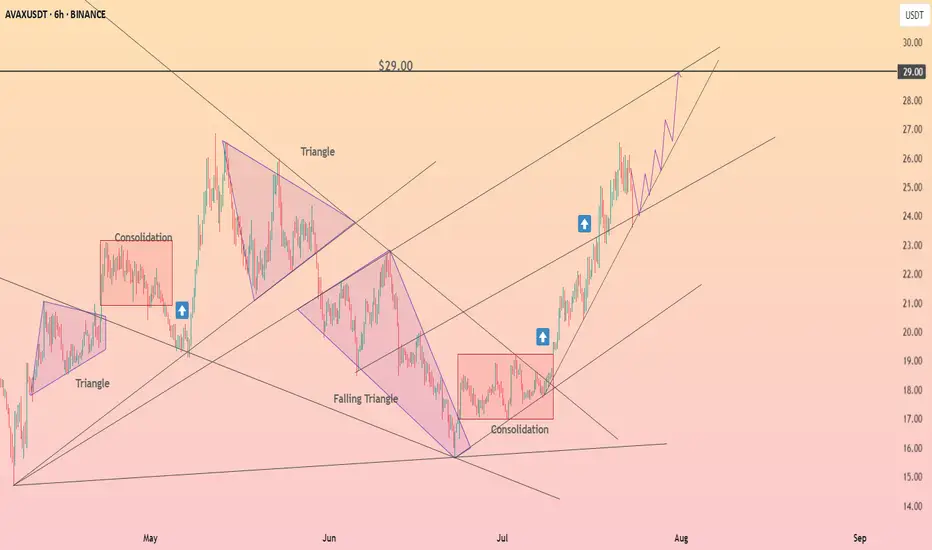
HolderStat┆AVAXUSD retest of trend lineBYBIT:AVAXUSDT has climbed steadily through a falling channel breakout and now trades firmly above $20.50. With triangle breakouts behind it, the next likely zone is $24–$25. Price action is aligning with bullish continuation patterns.

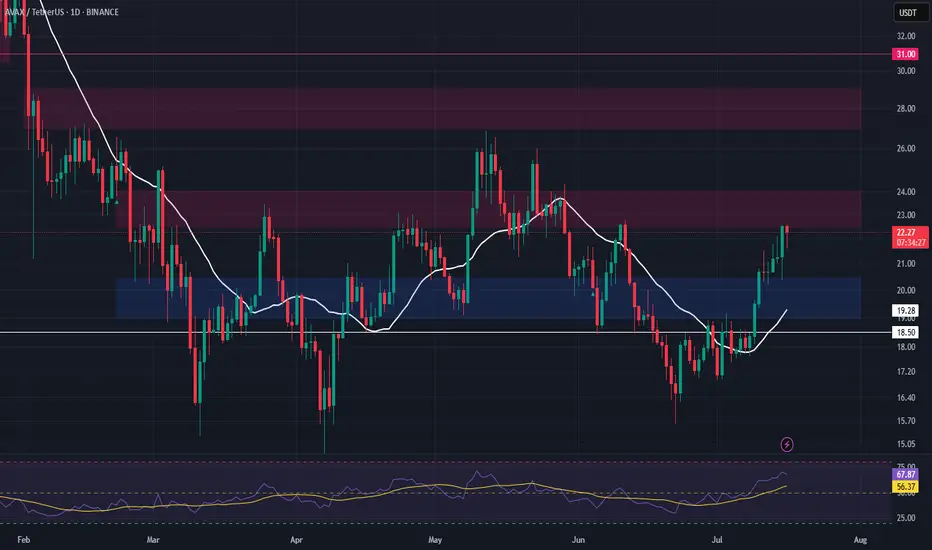
Avalanche, Why with Leverage? Exponential Moving AveragesOn the 10th of July AVAXUSDT finally managed to break above EMA55 and EMA89 on a very strong, full green candle. This is the day the market bias turns bullish and is fully confirmed. Bullish of course happens soon with the higher low, 22-June, but confirmation only comes after certain resistance levels are cleared, after the pair in question trades at a certain price.
Notice yesterday's candle, there was a rejection but prices remained above EMA89—blue dotted line on the chart. Today, we have a small candle with the same dynamics: A little lower then higher but still, above EMA89. The action is happening above 0.148 Fib.
These levels, EMA55, EMA89 and 0.148 Fib. extension all expose a strong support zone. As long as AVAXUSDT trades above them, we can expect maximum growth. That's why leverage is possible. With a well defined support range we can set the stop-loss right below and let the market take care of the rest.
Since both days failed to move prices lower, yesterday and today, and we know where the market is headed thanks to Bitcoin and the other altcoins that moved ahead, we can bet that Avalanche will grow and will do so strong. This is a safe bet.
Remember to do your own research and planning. Leveraged trading should be approached by experienced traders only. The same chart setup can be approached spot with minimum risk. Below 5X is also very low risk but higher is possible on this setup. Buy and hold, the market takes care of the rest. Great prices and entry timing.
Your support is appreciated.
Namaste.

HolderStat┆AVAXUSD seeks to the $20OKX:AVAXUSDT is coiling inside an ascending triangle with resistance at 19.96. If this level is broken, price may rally toward 21.00 and beyond, supported by strong structure and repeated bullish formations.

HolderStat┆AVAXUSD decline from the trend lineBYBIT:AVAXUSDT has reclaimed key support near 17.63 USDT and is testing the $20 barrier after bouncing from a falling channel. The structure is bullish with higher lows forming. If price breaks above $20, the next target lies toward 25 USDT.

TradeCityPro | AVAX Holds Key Support in Sideways Structure👋 Welcome to TradeCity Pro!
In this analysis, I want to review the AVAX coin for you. It’s another Layer1 and RWA project whose coin has a market cap of 7.48 billion dollars and ranks 16th on CoinMarketCap.
📅 Daily Timeframe
On the 1-day timeframe, as you can see, the price is sitting on a very important and strong support at the 16.46 zone, which I’ve marked as a range for you.
🔍 This range is where buyer makers are heavily present, and the price has touched it three times so far and has been supported each time. This shows the high strength of this zone.
✨ Currently, after being supported from this zone, the price has reached the 18.77 level and is fluctuating below this level. Volume is also gradually decreasing, and we have to see what happens next.
📊 If the volume keeps decreasing like this, the price will probably continue ranging between 16.46 and 18.77 until volume enters the market. But if strong buying or selling volume enters, the price can make a move and exit this range.
✔️ If buying volume enters and the price wants to move upward, we can enter a long position with a break of 18.77 and even buy in spot. A confirmation for this position could be the RSI breaking above the 50 level.
🛒 I personally consider this trigger suitable for a long position, but for spot I suggest waiting for a break of 25.78. More important than that is Bitcoin dominance, and in my opinion, as long as the long-term trend of Bitcoin dominance is bullish, buying altcoins is not logical and we have to wait until dominance changes trend.
📉 If the price wants to move downward and selling volume enters the market, the break of this same support range would be the best trigger. With a break of 16.46, we can enter a short position, and if you already bought this coin in spot, you can activate your stop-loss as well.
💥 A momentum confirmation for this position would be the RSI breaking below the 30 level and the oscillator entering the Oversell zone.
📝 Final Thoughts
This analysis reflects our opinions and is not financial advice.
Share your thoughts in the comments, and don’t forget to share this analysis with your friends! ❤️

Avalanche 2025 All-Time High, Accumulation & Bullish ZonesI am using $495 as the next bullish cycle top. The 2025/26 bull market all-time high. It can be more but it can also be less. We can only guess at this point because the Cryptocurrency market is just so young that everything becomes possible. We err by being conservative.
Avalanche is trading within a long-term accumulation zone. The best possible prices, literally.
The purple-rounded bottoms on the chart denotes an excess.
This year, 2025, the accumulation zone was activated in February. The action then moved within this orange-zone in March and this is where everything is happening now.
If you wanted to put tens of millions of dollars into this project at the best possible prices pre-2025 bull market wave, then you would need to do it based on the long-term. Back in July-August-November 2024 and February, March, April, June and so on 2025.
If you were to buy too big too fast it would push prices up. So whales wait months in order to accumulate. After years of accumulation at low prices, they send the signal and the market can move. Once the market starts moving, the consolidation/accumulation period is over, there is no going back.
The "neutral zone" here is light blue. This is already bullish but not ultra-bullish because there is no continuation inside this zone. Only when Avalanche (AVAX) moves and stays above it we can get a new bull market cycle. Since it only happens every four years, like clockwork, there is no need to guess.
Pre-2021 we buy as much as we can and sell when prices are high up. Post 2021 bearish, SHORT, SHORT, SHORT. After 2022 comes the transition period, the long-term accumulation and consolidation phase. In 2025 is the next bull market, this is where we are at now.
So now we can buy as much as we can but only with the intention to sell when prices are up.
An investor does not sell, only buys forever more. But still, if you are an investor, you shouldn't buy when prices are high. The time is now to accumulate on everything.
A trader sells every few weeks, every few months. Each wave. Buy support (low) and sell resistance (high). Buy low (red) and sell high (green).
You need to know clearly if you are trading or investing. Getting things confused can result in loses. Getting this topic confused simply means lack of planning.
We are entering a major bullish cycle and wave. This is not the time to be a trader if you've never traded before. This is the time to invest, accumulate; buy and hold. Sell only when prices are astronomically high.
When the bullish cycle is over and if you find a pair trading at support, you can buy to sell again within weeks or months. But not now. Now, after you buy, you hold. Makes sense?
We are in this together.
I love you!
Your continued support is appreciated, truly.
Namaste.

AVAX/USDT – Bullish Channel Setup with Strong Risk/RewardAVAX is currently respecting a clear bullish channel on the 1H timeframe. Price just tapped the lower trendline and key Support Zone #1, forming a potential higher low setup.
If this trendline holds, I’m expecting a bounce targeting the 19.50–20.00 resistance zone — aligning with the top of the channel.
📌 Entry Zone: Around 17.50
🎯 Target: 19.50–20.00
🛑 Stop: Below 16.90
This setup offers a clean risk-to-reward and follows the broader channel structure. Watching for a confirmation bounce or bullish engulfing candle off support before entering.
💬 Let me know what you think — bullish continuation or deeper pullback incoming?
#AVAX #CryptoTrading #PriceAction #BullishChannel #TradingView #TA #Altcoins
