Avalanche Update: Easy 510% Profits TargetThis is a perfect chart setup. Price dynamics are revealing a strong potential for the development of a major bullish wave; let me explain.
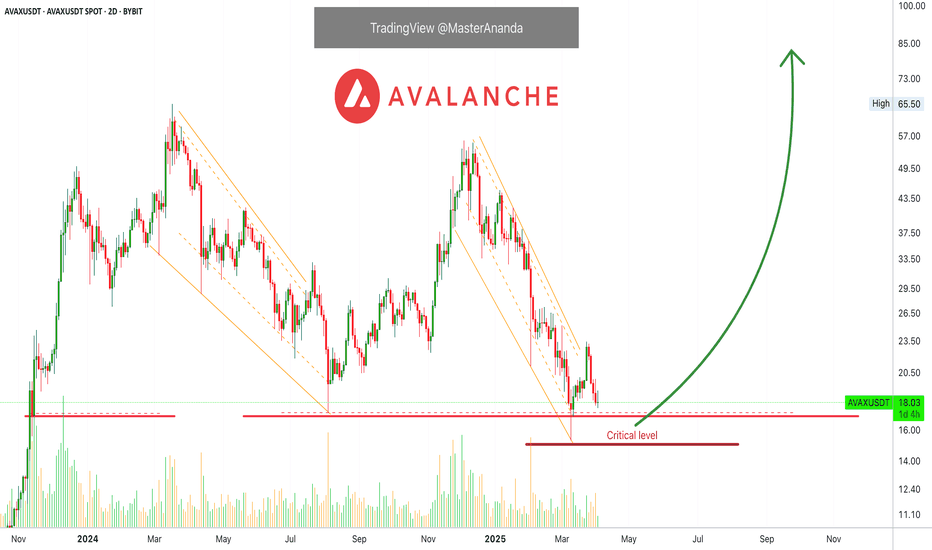
There was a low around 10-March, followed by a small bounce. This small bounce I take as an early reversal signal but being early caution is advised. Then we have another support in the critical zone.
The initial bounce produced a lower low but there was strong buying right at the "critical level," this signal is strong. The low session ended as a Doji and is immediately confirmed by two days of green. Volume is high on the buy. Prices are now up.
Touch and go. There was a drop below support but the action recovered right away. A failed signal for the bears, a bullish reversal is in place.
Seeing marketwide action, Bitcoin and everything we already know, Avalanche is preparing for a nice up-thrust. This can be big, many times bigger than anything we've seen in several years. We are going up.
An easy target is mapped on the chart, it goes beyond 300%. 500%+ can be achieved within months. So much more by the time this year ends. It will be great.
Thank you for reading and for your continued support.
Early is best. Keep it simple.
Namaste.
Avax
AVAX Set for a 90% Takeoff — Catch It Before the Lift-Off! (1D)AVAX has reached the weekly support zone.
The structure is still bearish, but there is an expectation that enough buy orders exist in this area to create a bullish substructure.
One resistance base ahead of the price has already been consumed, and above that base, there is a liquidity pool that may get swept.
Targets are marked on the chart.
A daily candle close below the invalidation level will invalidate this analysis.
invalidation level : 11.09$
Do not enter the position without capital management and stop setting
Comment if you have any questions
thank you
Avalanche is trying to bottom out here. Watch list material. AVAX is holding nicely with the double bottom. However, a CHOCH is needed to have a better confirmation of a reversal. Momentum and trend oscillators are diverging bullishly however without market structure be careful with risk.
Full TA: Link in the BIO
AVAXUSD cooking massive Triangle bullish tradeAvalanche / AVAXUSD is trading inside a massive Triangle pattern for the entirety of its history.
The price just hit its bottom this week and is rebounding with force.
The first target is 45.000, right at the top of the pattern.
If however the 2021 Bull Cycle is confirmed then the price can break massively above the Triangle and exceed $300, but this is arguably an ambitious target.
Follow us, like the idea and leave a comment below!!
Possible Scenario for AVAX/USDTPossible Scenario for AVAX/USDT:
1. Price Action: The price is within a descending channel marked by the blue lines. This suggests a bearish trend as the price has been making lower highs and lower lows.
2. Potential Scenarios:
- The **green arrow** indicates a potential bullish scenario, where the price might break out to the upside, aiming toward a target of around $31.84.
- The **red arrow** suggests a bearish scenario, where the price might break down further, potentially testing the lower support level near $11.91.
3. Key Levels:
- **Resistance**: Around the $31.84 level (shown in red), which could be a strong resistance zone if the price attempts a recovery.
- **Support**: Near the $11.91 level (shown in green), which could act as strong support if the downtrend continues.
Avalanche's Higher Low Indicates The Bottom Is InAVAX is currently trading above its August 2024 bottom low price, and this is bullish.
AVAXUSDT produced a major low on the 10-March trading session. The current session is a higher low compared to this date. This is a double bullish signal. The August low and last month. Both are active, valid and hold.
So the August 2024 low was actually tested and pierced but the session close happened above this level. The bottom back then was $17.27. In March, AVAXUSDT went as low as $15.30 but closed at $17.51. The next session went below again and hit $16.95 but closed at $18.5. As you can see, the bulls win.
The current session is green after four sessions closing red. Each session has two candles, 48 hours (2D candles).
Here we have the activation of long-term support. Classic behaviour before a major bullish run.
The dynamic is always this: The correction unravels and gains momentum before reaching its end. When it hits bottom, there is a strong reaction causing a sudden bullish jump. This bullish jump is short-lived and quickly corrected. This short-term correction ends in a higher low. From this higher low, prices start a new wave of growth. We are entering this new growing phase now.
Thanks a lot for your continued support.
This is another time based chart.
The time to enter is now, always focusing on the long-term.
We buy now with the patience and mindset to hold between 6-8 months. If this can be done, easy and big wins will be yours.
The 2025 All-Time High potential and more can be found by visiting my profile.
Thanks a lot for the follow. Your support is appreciated.
Namaste.
AVAX DAILY ANALYSISHi friends,
Let's get back into analysis after Eid al-Fitr vacations.
Today, we pay attention to AVAX in the Daily time frame.
As marked on the chart, we have a strong daily resistance trend line and a 4-Hour resistance trend line, which is marked by yellow color. As you can see that we had a great support level of $19.855, which has now turned into resistance.
Also, you can see that for AVAX to retain its bullish momentum, it has to close daily candles above $29. Besides that, we have a strong daily and weekly accumulation area between $12 and $15.
We have a local 4-Hour support level that is ideal for entering into short positions after having the momentum and confirmations.
Avax long term.This is my opinion on Avax.
I think the downward waves are good buying opportunities, while the upward waves after that can be good selling opportunities.
* What i share here is not an investment advice. Please do your own research before investing in any digital asset.
* Never take my personal opinions as investment advice, you may lose all your money.
Avalanche AVAX Will Reach $100+ In 2025!Hello, Skyrexians!
Let's make an update on BINANCE:AVAXUSDT the coin with the most clear Elliott waves structure. We have some changes since our last update.
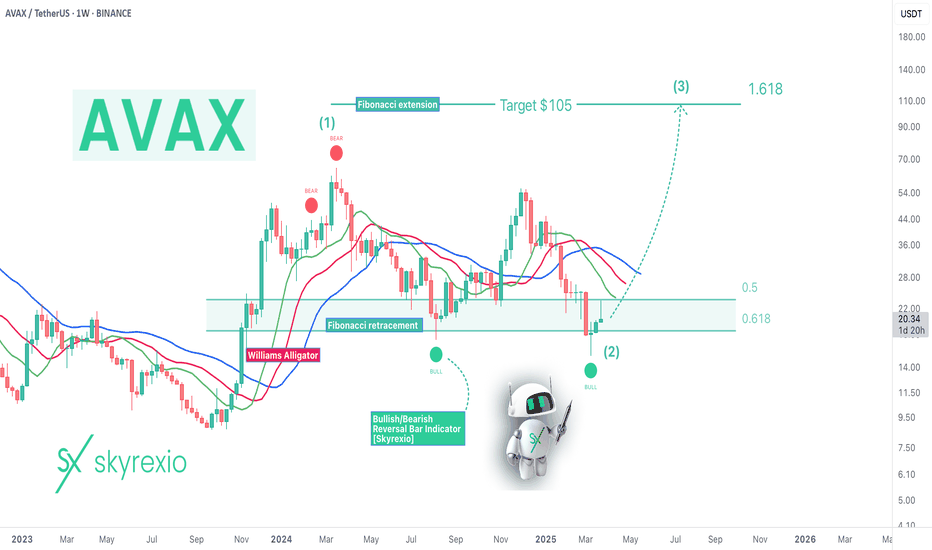
Let's take a look at the weekly chart. We can count the growth from the bottom to the March 2024 top as the wave 1. After that we can see the flat correction ABC in the wave 2. The great sign that price has printed even 2 green dots on the Bullish/Bearish Reversal Bar Indicator inside the Fibonacci 0.61 zone. We expect that for this asset correction is over and the next target is 1.61 extension for the wave 3. Now it's located at $105.
Best regards,
Skyrexio Team
___________________________________________________________
Please, boost this article and subscribe our page if you like analysis!
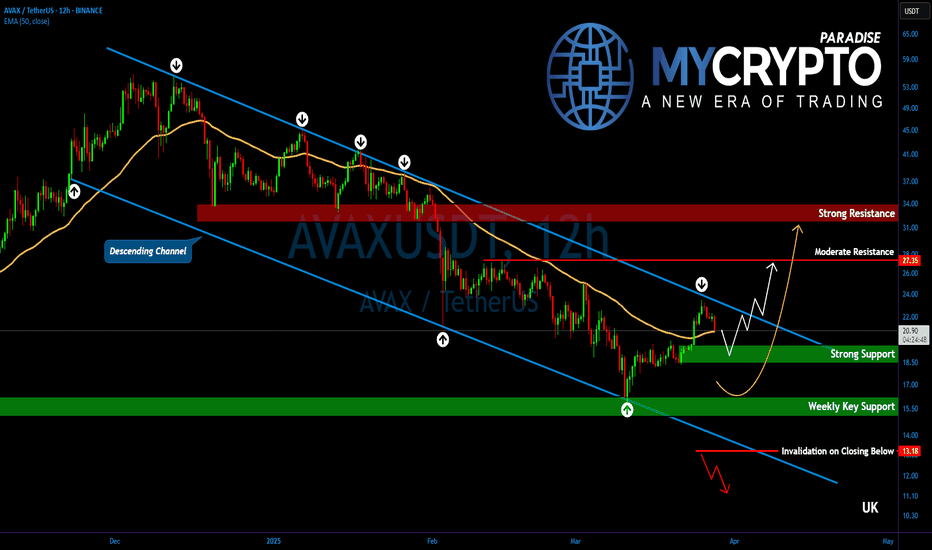
AVAX Is Approaching a Make-or-Break Level — What Comes Next?Yello, Paradisers! Is #AVAX finally waking up after months of bearish slumber, or is this just another bull trap? After moving within a well-defined descending channel for weeks, we are now seeing the first real shift in structure: AVAXUSDT has just broken above its 12-hour EMA convincingly for the first time since November 2024. This development may be a strong early signal of a potential corrective move to the upside.
💎At the moment, #AVAXUSDT is testing a critical resistance at the $23.50 level, which lines up with the descending trendline that has capped price since December 2024. A breakout above this zone would significantly increase bullish momentum, with the next target likely at $27.35 — a key area of moderate resistance that could temporarily halt upward movement.
💎However, $27.35 is not expected to be an easy level to break. Sellers will likely defend this zone, potentially causing short-term volatility. But if bulls manage to flip it into support, the path opens toward the $31.20 to $34.00 region. This higher resistance area is even more significant as it aligns with the 50% Fibonacci retracement level — a major technical barrier where many traders will be looking to take profits or fade the rally.
💎On the downside, AVAX has established a strong support range between $19.50 and $18.80. If this short-term support fails, we then look to the weekly support zone between $16.20 and $15.00, which continues to serve as a long-term base structure. As long as AVAX holds above this broader support, the larger bullish outlook remains intact.
Paradisers, strive for consistency, not quick profits. Treat the market as a businessman, not as a gambler.
MyCryptoParadise
iFeel the success🌴
AVAX Trade Setup - Waiting for Retrace to SupportAVAX has had a strong run over the last two weeks. Now, we're waiting for a retrace to key support before entering a long spot trade.
🛠 Trade Details:
Entry: Around $20.00
Take Profit Targets:
$23.50 (First Target)
$31.00 (Extended Target)
Stop Loss: Just below $18.00
Watching for buying pressure at the support level before confirming the move! 📈🔥
$AVAX: Avalanche – Snowballing Gains or Melting Away?(1/9)
Good evening, everyone! 🌙 CRYPTOCAP:AVAX : Avalanche – Snowballing Gains or Melting Away?
With AVAX at $23.07, is this blockchain beast a sleeper hit or a slippery slope? Let’s avalanche into it! 🔍
(2/9) – PRICE PERFORMANCE 📊
• Current Price: $ 23.07 as of Mar 25, 2025 💰
• Recent Move: Up from $18, below $40 highs, per data 📏
• Sector Trend: Crypto volatile, AVAX rides the waves 🌟
It’s a rollercoaster—hold tight for the drop! ⚙️
(3/9) – MARKET POSITION 📈
• Market Cap: Approx $9.56B (414.78M tokens) 🏆
• Operations: Scalable L1 for DeFi, dApps, subnets ⏰
• Trend: $1.121B DeFi TVL, whale buys, per posts on X 🎯
Firm in L1 race, but market’s a blizzard! 🚀
(4/9) – KEY DEVELOPMENTS 🔑
• Whale Action: 500K tokens moved, per posts on X 🌍
• DeFi Strength: $1.121B TVL holds firm, per data 📋
• Market Vibe: Bearish Fear Index (34), yet resilient 💡
Snowballing quietly amid crypto storms! ❄️
(5/9) – RISKS IN FOCUS ⚡
• Market Correction: Bearish pressure could sink it 🔍
• Competition: Solana, Ethereum vie for dApps 📉
• Macro Woes: Trade tensions, rates shake things ❄️
It’s a chilly slope—brace for ice! 🛑
(6/9) – SWOT: STRENGTHS 💪
• Scalability: 4,500 TPS, beats rivals 🥇
• DeFi Base: $1.121B TVL, solid ecosystem 📊
• Adoption: Enterprise use grows, per data 🔧
Got a snowy peak of potential! 🏔️
(7/9) – SWOT: WEAKNESSES & OPPORTUNITIES ⚖️
• Weaknesses: Volatility, high off $59 peak 📉
• Opportunities: Whale buys, subnet growth 📈
Can it snowball or melt under pressure? 🤔
(8/9) – POLL TIME! 📢
AVAX at $23.07—your take? 🗳️
• Bullish: $30+ soon, whales fuel it 🐂
• Neutral: Steady, risks balance out ⚖️
• Bearish: $18 looms, correction hits 🐻
Chime in below! 👇
(9/9) – FINAL TAKEAWAY 🎯
AVAX’s $23.07 price tags a volatile gem 📈, with DeFi strength but market risks 🌿. Dips are our DCA jackpot 💰—buy low, ride high! Gem or bust?
AVAX/USDTHello friends
As you can see, the price has been well supported by buyers from the specified support area...
Now you can buy in steps with capital and risk management and move to the specified targets.
The red resistance area can also cause a price correction, so be careful and take profit.
*Trade safely with us*
avax buy limit midterm "🌟 Welcome to Golden Candle! 🌟
We're a team of 📈 passionate traders 📉 who love sharing our 🔍 technical analysis insights 🔎 with the TradingView community. 🌎
Our goal is to provide 💡 valuable perspectives 💡 on market trends and patterns, but 🚫 please note that our analyses are not intended as buy or sell recommendations. 🚫
Instead, they reflect our own 💭 personal attitudes and thoughts. 💭
Follow along and 📚 learn 📚 from our analyses! 📊💡"
#AVAX/USDT#AVAX
The price is moving within a descending channel on the 1-hour frame, adhering well to it, and is heading for a strong breakout and retest.
We are seeing a bounce from the lower boundary of the descending channel, which is support at 18.22.
We have a downtrend on the RSI indicator that is about to be broken and retested, supporting the upward trend.
We are looking for stability above the 100 Moving Average.
Entry price: 19.12
First target: 19.55
Second target: 20.14
Third target: 20.74
Is #AVAX Making Much Needed Comeback or Another Bull Trap Ahead?Yello, Paradisers! Is #AVAX on the verge of a major breakout, or is this just another bull trap? Let's look at the latest setup of #Avalanche:
💎#AVAXUSDT has been stuck inside a falling wedge for weeks, respecting both the descending resistance and descending support levels. However, bulls have finally pushed through the upper trendline, signaling a potential shift in market sentiment. The question now is: will it sustain the momentum, or will we see a sharp rejection at key resistance levels? AVAX has been stuck inside a falling wedge for weeks, the breakout shows a high probability of an impulsive move toward the highlighted zones.
💎The immediate support to keep an eye on sits around $18.38, a level that could act as a strong demand zone if retested. Below that, $16.61 serves as a critical invalidation level for the bullish setup. A breakdown here would shift the momentum back in favor of the bears.
💎On the upside, #AVAX faces its first major challenge between $23.00 and $26.00, where sellers are likely to step in. A clean breakthrough of this zone would open the door for a more aggressive rally. RSI & Volume Confirmation – The RSI is showing early signs of strength, but volume confirmation is still needed. A strong push above the resistance zone on high volume would solidify the bullish breakout.
💎If #AVAXUSD can flip $18.38 into strong support, we could see an impulsive move toward the $23-$26 range. However, a failure to hold support could result in a bearish breakdown toward the $14 region.
The market rewards discipline and patience—trade smart, Paradisers!
MyCryptoParadise
iFeel the success 🌴
AVAXUSD Channel Down bottomed. Bullish Leg to target $45.Avalanche (AVAXUSD) has been trading within a Channel Down for the past 12 months and on March 11 it priced the latest Lower Low. At the same time, the 1D RSI is on an uptrend, a technical Bullish Divergence.
It is the same kind of Bullish Divergence we also saw on the August 05 2024 Lower Low bottom. That bottom produced a Bullish Leg that almost reached the 0.9 Fibonacci retracement level. As a result, we can turn bullish here, targeting a $45.00.
-------------------------------------------------------------------------------
** Please LIKE 👍, FOLLOW ✅, SHARE 🙌 and COMMENT ✍ if you enjoy this idea! Also share your ideas and charts in the comments section below! This is best way to keep it relevant, support us, keep the content here free and allow the idea to reach as many people as possible. **
-------------------------------------------------------------------------------
💸💸💸💸💸💸
👇 👇 👇 👇 👇 👇
avax sell midterm "🌟 Welcome to Golden Candle! 🌟
We're a team of 📈 passionate traders 📉 who love sharing our 🔍 technical analysis insights 🔎 with the TradingView community. 🌎
Our goal is to provide 💡 valuable perspectives 💡 on market trends and patterns, but 🚫 please note that our analyses are not intended as buy or sell recommendations. 🚫
Instead, they reflect our own 💭 personal attitudes and thoughts. 💭
Follow along and 📚 learn 📚 from our analyses! 📊💡"


