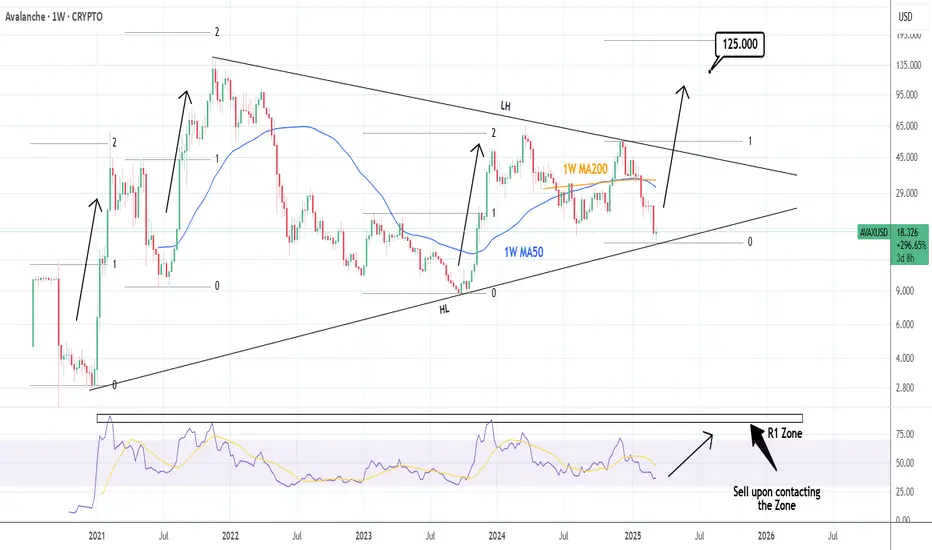
AVAXUSD: Could target $125 by the end of this CycleAvalanche is bearish on its 1D technical outlook (RSI = 38.910, MACD = -2.280, ADX = 35.079) but the bullish dynamics should start accelerating now as the price hit the HL trendline of December 2020. This is the bottom of the multi year Triangle pattern and with the 1W RSI as low as the August 5th 2024 bottom, we expect the final rally of this Bull Cycle to start. Technically it should break above the LH trendline as all Bull Cycle rallies hit (or came close to) their 2.0 Fibonacci extension. Buy and aim for slightly below it (TP = 125.000).
## If you like our free content follow our profile to get more daily ideas. ##
## Comments and likes are greatly appreciated. ##
Avax
avax long midterm "🌟 Welcome to Golden Candle! 🌟
We're a team of 📈 passionate traders 📉 who love sharing our 🔍 technical analysis insights 🔎 with the TradingView community. 🌎
Our goal is to provide 💡 valuable perspectives 💡 on market trends and patterns, but 🚫 please note that our analyses are not intended as buy or sell recommendations. 🚫
Instead, they reflect our own 💭 personal attitudes and thoughts. 💭
Follow along and 📚 learn 📚 from our analyses! 📊💡"
Avalanche: Pending LowWith the recent sharp pullback, AVAX has entered the lower third of our magenta long Target Zone between $24.42 and $13.30. The low of the turquoise wave 2 is approaching and should form well above the $8.64 support. From the bottom of wave 2, we expect a rally in the turquoise impulse wave 3, which should aim for the current all-time highs of the last bull run.

Avalanche (avax)Avax usdt Daily analysis
Time frame daily
As you see on the chart , if decrease of avax stops on 17.5 $ the pattern (double bottom)will create.
So we will see the end of decreasing and avax will reach to 25$
On the other hand , if price breaks down and reach 15 EURONEXT:OR less , this pattern will failed

AVAX/USDT: BIG CHANCEHello friends
As the price reached a resistance area, we witnessed a double top pattern that caused the price to fall.
Now the price has been able to recover by reaching a strong support area and with the continued power of buyers, you can buy within the specified ranges and we have also specified targets for you.
*Trade safely with us*

Avalanche AVAX price analysis It's been a long time since we've had an analysis of CRYPTOCAP:AVAX
Well, we're sorry.... but inform you that OKX:AVAXUSDT price is now in a potential buying zone.
The main thing is that the price of the #Avalanche token does not fall much below $20
And the growth potential is the same as six months ago - at least up to $45-50
_____________________
Did you like our analysis? Leave a comment, like, and follow to get more

AVAX/USDTAfter working with liquidity, a daily IFVG has formed. If it holds the price, this will be a good long continuation, with growth targets as follows:
Target 1 = 25.11
Target 2 = 28.77

Avalanche: Long-Term Bullish Above Support & Other SignalsThe end of February didn't do much harm to Avalanche, which is a bullish signal. In early February, the lowest price hit was $21, in late February the lowest price was $20. The difference is only 5%. This small gap between these lows indicate that the bearish force is over.
Let me explain. There was a low on the 13-January session at $32, the low in February was $21. That's a big gap.
For a new low to be considered of any value from a technical standpoint, the minimum, after the $21 low, would be $17 or much lower around $9 or $8. When we get $21 first followed by $20, we are simply looking at a double-bottom. A double-bottom is a bottom pattern and tends to lead to a trend reversal.
The next little fact that is of interest to us, Cryptocurrency bulls, is the existence of a long-term support, on this chart labelled as "baseline." A lower low as mentioned above would require a break of this level. This is highly unlikely.
Well, let's not go too deep into this type of technical analysis, let's consider a different perspective.
In late 2023 after a strong period of sideways with a downward bent, a complex correction, AVAXUSDT moved to produce a 5-up waves bullish impulse. As this impulse ended, we have the same dynamics as before, between January and November 2023, a long complex correction.
The action that AVAX has been witnessing since March 2024 is all part of a correction in Elliott Wave Theory terms. Once this correction is over, we will have a new bullish wave. This bullish wave tends to develop in five steps. Three steps forward and two backwards. The 2025 bull-market. This impulse will end in a very strong new All-Time High.
This is simple technical analysis and it will end up being right.
Do you agree?
If you do, make sure to show your support by following me.
2025 is going to be big. It will be big. Trust.
Patience is key.
The worldwide adoption of Cryptocurrencies as a means of payments will result in world peace.
Namaste.

AVAX getting support on previous bottom?AVAX is back revising bottoms. If the price doesn't use it as support it is likely to see the price extend to lower levels. Momentum is oversold which is the ideal time to spot divergences and pivot structures.

AVAX/USDTThere is a liquidity removal from the bottom of the consolidation, on lower timeframes there is a structural break to the long, with the target being the upper range, and I would like to see a breakout from it.
Target 29

VIX daily - opex weekend at 28th FebWe are heading into an OPEX this 28th of Feb.
Volatility is running and seems like fear is all over.
Crypto is crashing and people are talking about fear and losing everything....
Well, the big whales are buying the dip and Eric Trump just tweeted about buying the dips.
For having a bottom process, it is essential to see the TVC:VIX hit that 23-25 area while its #RSI should be around 70 on the Daily chart.
In that way, we are more likely to have the bottom area and see the market turn and hard.
The US10Y is now at 4.3% which is going down and pushes the NASDAQ:TLT to higher prices.
I lean to the local bottom around 580-585 in the AMEX:SPY with a nice capitulation move that seems to be coming exactly with the OPEX and with liquidity issues in the entire market and in crypto.
I am looking to buy the dip and keep adding to my long positions in crypto.
CRYPTOCAP:AVAX CRYPTOCAP:ETH CRYPTOCAP:BTC $PAAL $DSYNC $AINTI AMEX:NHC LSE:ALU MYX:ASTRA $XBG and much more.

AVAX MID TERM IDEASummary:
Support Zone: $22.7 - $15.7 USDT (Demand Area).
Resistance Levels: $30, $35, and $45 USDT.
Short-Term: Downtrend continues, but signs of recovery can be monitored within the demand zone.
Mid-Term: A breakout above $30 USDT signals a potential trend shift.
Long-Term: If it recovers from the demand zone, the target range could extend to $45-$65 USDT.
Strategy:
Entry: Buy within the $22.7 - $15.7 USDT demand zone, with a stop loss below $15.5 USDT.
Targets: $30, $35, and $45 USDT.
Bearish Scenario: A drop below $15.7 USDT may increase selling pressure.

AVAX | ALTS | Possible for BOUNCE HEREAVAX hasn't yet made a glorious ATH, but on the flip side - this means that there is great potential for upside, specifically from this support zone.
If we take a look at the percentage the price has previously bounces from this particular support level, it's quite significant - although it wasn't over night. This support zone is roughly between 20-22 and may be a great place for a swing.
Make sure you check out yesterday's update on LINK; also showing promise for another impulse wave up:
__________________
BINANCE:AVAXUSDT

CHEAP DEX's are a proven crypto technology...are straightforward to grasp and this sector is likely to experience a rebound from these low points. Following a Memecoin downturn, they should attract greater investor interest and capital influx.
Kicking off with #JOE
Year Founded: Trader Joe emerged in 2021 and has swiftly established a solid standing in the DeFi landscape. Its ongoing innovation and growing user base highlight its dependability and potential for expansion.
Reputation and Reviews: Users have lauded Trader Joe for its user-friendly interface, minimal transaction fees, and extensive array of DeFi offerings. The community-focused support system and attentive moderators further bolster its standing.
Security Methods: The platform implements stringent security protocols, including routine audits by esteemed firms like HashEx and Paladin. This guarantees the reliability and safety of its smart contracts, instilling confidence in users regarding the platform’s security.
Transparency: Trader Joe is open about its operations, consistently sharing audit findings and engaging with its community through social media and other channels. This dedication to transparency fosters trust and accountability.
Volume Managed: Trader Joe handles significant trading volumes, highlighting its popularity and reliability. Elevated trading volumes also enhance liquidity, facilitating smoother trade executions for users.
Trader Joe emerges as a dynamic decentralized exchange (DEX) on the Avalanche network, providing a comprehensive range of DeFi (decentralized finance) services such as trading, yield farming, staking, and lending.
At a price below 25 cents, it should be taken into account for potential increases.

Avalanche AVAX Is About To Make 10X!Hello, Skyrexians!
Today we have another one gem BINANCE:AVAXUSDT which has confirmed its strength and can make at least 10X in this bull run. Now we will explain why.
You can notice that the previous bull run was really huge, let's count it as an impulsive wave 1. The bear market retraced at 0.61 Fibonacci and found support there. Now this coin is in global wave 3. We thought earlier that wave 2 in this wave 3 has been finished already with the green dot at the Bullish/Bearish Reversal Bar Indicator , but price returned back to this level.
Nothing bad has happened this is still wave 2, but in shape of irregular ABC correction. From the current price we expect the move at least to $250 in 2025.
Best regards,
Skyrexio Team
___________________________________________________________
Please, boost this article and subscribe our page if you like analysis!

AVAX Long Trade OpportunityMarket Context:
AVAX is testing a major support level and showing signs of potential reversal or consolidation at this price zone, which offers a favorable risk-to-reward ratio.
Trade Details:
Entry Zone: Around $24.00
Take Profit Targets:
$30.50 - $35.00
$41.50 - $45.00
Stop Loss: Just below $21.20
This trade looks to capitalize on the support hold for a potential upside breakout. 📈

AVAXUSDT 1WAVAX ~ 1W Analysis
#AVAX Buy gradually from here if you still have a Conviction on this Coin. with a minimum target of 20%+.

COQ Inu: The Memecoin Poised for a 300% Surge on AVAX BlockchainCOQ Inu, the #1 memecoin built on the Avalanche (AVAX) blockchain, has emerged as a standout contender. Despite a recent drop from its all-time high market cap of $400 million to $80 million, technical and fundamental analysis suggests that COQ Inu is gearing up for a potential 300% surge, which could propel its market cap back to $100 million and beyond.
Technical Analysis
The chart patterns for COQ Inu reveal a compelling story. After a significant correction from its peak, the coin is now showing signs of consolidation, with key indicators pointing to an impending breakout. Here’s what the technicals are saying:
The RSI, a momentum oscillator that measures the speed and change of price movements, currently stands at 63.31. This indicates that COQ Inu is neither overbought nor oversold, but rather in a healthy position to potentially initiate another leg up. An RSI above 50 typically signals bullish momentum, and with the current reading, COQ Inu is primed for upward movement.
The 38.2% Fibonacci retracement level is acting as a strong support for COQ Inu. In the event of a pullback, this level is expected to hold, providing a solid foundation for the next upward move. However, a break below this level could see COQ Inu testing its 1-month low, which would be a critical point for traders to watch.
A breakout above the 1-month high pivot could serve as the catalyst for the anticipated 300% surge. Such a move would not only validate the bullish sentiment but also attract new investors looking to capitalize on the momentum. The 1-month high pivot is a key resistance level, and a decisive break above it could trigger a significant upward trajectory.
Market Position and Potential
Currently ranked #425 on CoinMarketCap with a live market cap of $81 million, COQ Inu has already established itself as a significant player in the memecoin arena. With a circulating supply of 69.42 trillion COQ coins, the coin’s low price per unit makes it accessible to a wide range of investors. The potential for a 300% surge could see COQ Inu’s market cap reach $200 million, placing it among the top memecoins in the market.

Avax analysis: How far will the fall continue...hello friends
Considering the drop we have, now we have to find the best support and check the reaction to the support when the price reaches that level.
We have obtained an important support for you, which can be moved up to the specified targets according to the price reaching there and maintaining the support.
*Trade safely with us*

AVAXUSDT | 15M | SCALPING TIME Hey There;
Thanks to everyone who supports my analysis with likes.🫡
SIGNAL ALERT
SELL AVAX > > 25,32 OR 25,50
🟢TP1: 25,00
🟢TP2: 24,80
🟢TP3: 24,00
🔴SL: 26,56
RISK REWARD - 1.15 RR
🔻Don't forget to press the like button not to miss the updates of this analysis.

Trading opportunity for AVAXUSDTBased on technical factors there is a Buy position in :
📊 AVAXUSDT
🔵 Buy Now or by Breakout
🪫Stop loss 21.00
🔋Target 33.70
📏 R/R 2
💸RISK : 1%
We hope it is profitable for you ❤️
Please support our activity with your likes👍 and comments📝

AVAXSo I have been getting into the NFT art scene, which uses avalanche, so i figure i might as well make a chart to help the artists im purchasing from get their best deal on convertions. So avax has a solid support here around the $25.30 range... this is the best area for the artsist to sell and then i can see avalanche running up to $30-$31 which is the buys time to purchase art...

AVAX/USDTAfter the liquidity was taken out at the November low, the coin is showing a good reaction. I have highlighted the zone for buying the coin.
Targets for growth:
Target 1 = 30.35
Target 2 = 36.15
