AVALANCHE (AVAX) the last chance (bottom) and the range market Hello 🐋
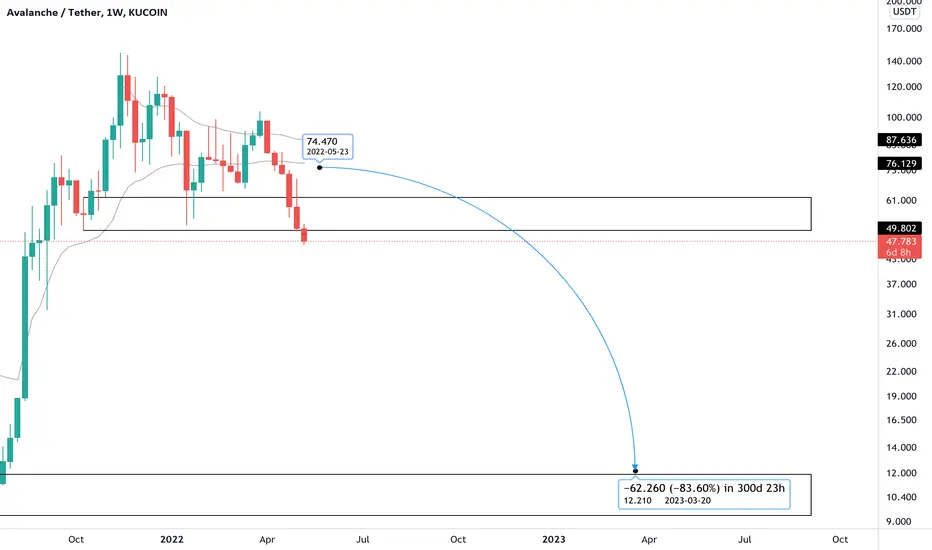
Based on the chart, the price is close to the channel support and the major support (bottom) or better to say the previous zone that started its amazing pump to the upside ✔️
if
the price breaks the resistance area to the upside, we will see more gain besides the range market is acceptable scenario too 📖💡🚀
and
if the price break the rang area to the upside, we will see more pump 🚀
Please, feel free to share your point of view, write it in the comments below, thanks 🐋
Avaxanalys

$AVAX still to go lower?personally i was aiting for it go 11$ when btc goes 20k but btcD started dumping and avax didn't reach. As accumulation zone might start from 10$ but personally i want near 1-4$ first and then lower. it feels unrealistic but this is the bear market where 99% coin will go too zero.

Avalanche AVAX Price Targets and Stop LossAVAX/USDT short
Entry Range: $90.50 - 98.70
Take Profit 1: $84.80
Take Profit 2: $73.30
Take Profit 3: $67.45
Stop Loss: $104.40

#AVAX/USDT 2Hour UPDATE !!As we can see from the above-mentioned chart that AVAX printed an inverse head and shoulder pattern and broke the neckline.
Now it's moving to retest the neck line so here we can take entry for approx 40% profit.
Hello dear traders, we here new so we ask you to support our ideas with your LIKE and COMMENT, also be free to ask any question in the comments, and we will try to answer for all, thank you, guys.
Remember:-This is not a piece of financial advice. All investment made by me is at my own risk and I am held responsible for my own profit and losses. So, do your own research before investing in this trade.
Thanks for your time, we hope our work is good for you, and you are satisfied, we wish you a good day and big profits.
THANK YOU.

#AVAX/USDT 1DAY UPDATE BY CRYPTOSANDERS !!Welcome to this quick AVAX/USDT analysis.
I have tried my best to bring the best possible outcome in this chart.
Reason of trade:- AVAX/USDT PARALLEL CHANNEL brake the green zone and buy the dip and retest the PARALLEL CHANNEL green zone. (SPOT CALL)
Entry:-$23.69,29.63
Traget:- 140%
Stoploss:- $20.56
Remember:-This is not a piece of financial advice. All investment made by me is at my own risk and I am held responsible for my own profit and losses. So, do your own research before investing in this trade.
Sorry for my English it is not my native language.
Do hit the like button if you like it and share your charts in the comments section.
Thank you...

AVAXNot financial advice.
The essence of investing & trading is the intelligent and patient preying on the greed, fear, impatience, addiction and ignorance of the majority. It's definitionally Darwinian.

AVAXNot financial advice.
The essence of investing & trading is the intelligent and patient preying on the greed, fear, impatience, addiction and ignorance of the majority. It's definitionally Darwinian.
AVAX HAS BEEN TRADING WITHIN A DESCENDING CHANNEL. This asset has lost 2/3 of it peak value. But, is the fall in value over.
I hope we all learnt from this asset that FEAR OF MISSING OUT IS BAD. However, I am bullish LONGTERM.
SHARE YOUR THOUGHT, like, comment and follow

Support and Resistance on AVAX COIN. Support and Resistance on AVAX COIN. With these chart , you can trade according to it .

AVAXNot financial advice.
The essence of investing & trading is the intelligent and patient preying on the greed, fear, impatience, addiction and ignorance of the majority. It's definitionally Darwinian.

Avalanche longAvalanche bounced off the support level. Asset broke trough off the upper boundary of descending channel. Bullish movement to support level at 90.5 is expected to happen.

My Avax long positionmy long position for avax. definitely if DXY continued the rally the idea will be voided.

long trem Avaxit has a long-term dynamic support, if this support is broken, iwill enter the pullback, and if it grows and stabilizes above this support, iwill enter...

AVAX/USDT - Potential 69% SetupHello Traders!
AVAX is moving in a local uptrend, pushing the $98 resistance level several times. The price is testing the MA100 on the daily timeframe.
A "Rising Triangle" pattern has been formed on the chart, an upward exit from which shows a potential rise to the resistance level of $135.50
Looking for purchases is possible near the current price values of $74 - $82
Closing the deal using stop loss is reasonable in case the price goes lower than the level of $64
The targets will be price levels of
$125,00
$135,50
Good luck and watch out for the market
P.S. This is an educational analysis that shall not be considered financial advice

AVAX USDT ANALYSISAvax is performing well as other altcoins do. We broke the bearish TL, and now we can go even higher to $115. Just watch volume and sentiment on other altcoins.

AVAX formed a topless P - LONGTopless P is a sign of bullish momentum. First TP is $98. Will update you soon.


AVAX BUYBuying Avax again for the second time today.
Buying right here.
My stop loss and targets are on the chart.

AVAX Looks BullishOn the left (USD pair) shows a falling wedge where price has broken out of, this breakout should continue bullishly
The BTC pair on the right also looks bullish, having established a heavy support along the 1.618 Fibonacci circle line

AVAXUSDT It is possible to climbIf the price stabilizes above 100, the ascent speed will probably increase, I considered the price of 75 as a loss limit, but this is related to your trade, good luck
*This is just an analysis, Trade with risk management

AVAX Growing Relative to MarketAVAX growing relative to total crypto market & showing strength during the current bear market
See above
Bullish.

AVAXUSDT Next target!AVAXUSDT (1D Chart) Technical analysis
AVAXUSDT (4h Chart) Currently trading at $79
Buy level: Above $80
Stop loss: Below $60
Target 1: $94
Target 2: $119
Target 3: $144
Target 4: $180
Max Leverage 2x / Spot Market
Always keep Stop loss
Follow Our Tradingview Account for More Technical Analysis Updates, | Like, Share and Comment Your thoughts

AVAX/USDT BUY SETUP 50-100% POTENTIALAVAX Descending triangle Pattern
MACD Showing bullish crossover
Potential upward movement from here🚀
Target mentioned in the chart
Green line for long term target
The NEXT $LUNA Do't miss it!
Stoploss : $76.5
