AVAX/BTC - Avalanche: Failure Swing◳◱ On the $AVAX/ CRYPTOCAP:BTC chart, the Failure Swing pattern suggests indications that the trend may be gaining or losing strength. Traders might observe resistance around 0.0003463 | 0.0003632 | 0.0004041 and support near 0.0003054 | 0.0002814 | 0.0002405. Entering trades at 0.0003526 could be strategic, aiming for the next resistance level.
◰◲ General info :
▣ Name: Avalanche
▣ Rank: 21
▣ Exchanges: Binance, Kucoin, Huobipro, Bittrex, Hitbtc
▣ Category/Sector: Infrastructure - Smart Contract Platforms
▣ Overview: Avalanche is an open-source platform for launching decentralized finance applications and enterprise blockchain deployments in one interoperable, scalable ecosystem. Developers who build on Avalanche can create applications and custom blockchain networks with complex rulesets or build on existing private or public subnets.
◰◲ Technical Metrics :
▣ Mrkt Price: 0.0003526 ₿
▣ 24HVol: 60.761 ₿
▣ 24H Chng: 1.322%
▣ 7-Days Chng: 9.05%
▣ 1-Month Chng: 16.39%
▣ 3-Months Chng: -0.42%
◲◰ Pivot Points - Levels :
◥ Resistance: 0.0003463 | 0.0003632 | 0.0004041
◢ Support: 0.0003054 | 0.0002814 | 0.0002405
◱◳ Indicators recommendation :
▣ Oscillators: NEUTRAL
▣ Moving Averages: STRONG_BUY
◰◲ Technical Indicators Summary : BUY
◲◰ Sharpe Ratios :
▣ Last 30D: 4.42
▣ Last 90D: 0.28
▣ Last 1-Y: -0.18
▣ Last 3-Y: 0.97
◲◰ Volatility :
▣ Last 30D: 0.62
▣ Last 90D: 0.53
▣ Last 1-Y: 0.78
▣ Last 3-Y: 1.33
◳◰ Market Sentiment Index :
▣ News sentiment score is N/A
▣ Twitter sentiment score is 0.58 - Bullish
▣ Reddit sentiment score is 0.22 - V. Bearish
▣ In-depth AVAXBTC technical analysis on Tradingview TA page
▣ What do you think of this analysis? Share your insights and let's discuss in the comments below. Your like, follow and support would be greatly appreciated!
◲ Disclaimer
Please note that the information and publications provided are for informational purposes only and should not be construed as financial, investment, trading, or any other type of advice or recommendation. We encourage you to conduct your own research and consult with a qualified professional before making any financial decisions. The use of the information provided is solely at your own risk.
▣ Welcome to the home of charting big: TradingView
Benefit from a ton of financial analysis features, instruments and data. Have a look around, and if you do choose to go with an upgraded plan, you'll get up to $30.
Discover it here - affiliate link -
AVAXBTC

AVAX Rockets to New Heights! Get Ready to Ride the Bullish Wave
I witnessed Avalanche (AVAX) make a stunning 15% pump, propelling it towards its next resistance level of 0.34. Brace yourself, my friend, because AVAX is about to take off like never before!
AVAX has been on a remarkable journey lately, defying expectations and gaining significant momentum. The recent 15% surge has brought it tantalizingly close to breaking through the 0.34 resistance level, marking a potential turning point for this incredible cryptocurrency. This is not just a random spike, but rather a clear indication of the bullish wave that is building up behind AVAX.
Now, you might be wondering, "How can I ride this wave and make the most of this opportunity?" Well, my friend, it's time to consider taking a long position on AVAX. By going long, you can potentially capitalize on its upward trajectory and reap the rewards of its anticipated surge. The market sentiment is overwhelmingly positive, and AVAX's technical indicators are aligning perfectly to support this exciting rally.
Here's your call-to-action: Don't miss out on this golden opportunity to maximize your gains! Seize the moment and consider opening a long position on AVAX today. Take advantage of the current bullish sentiment and position yourself for potential profits as AVAX confidently smashes through the 0.34 resistance level.
Remember, timing is crucial in the crypto market, and AVAX's journey is just getting started. By taking a long position now, you position yourself ahead of the curve, ready to ride the wave as AVAX surges to new heights.
So, my friend, buckle up and join the AVAX revolution! Let's ride this bullish wave together and make the most of this exciting opportunity. Your potential for profit awaits!
Should you have any questions or need assistance in executing your trade, feel free to reach out by commenting below. I'm here to help you navigate this thrilling journey and ensure you make the most informed decisions.
Wishing you an exhilarating and prosperous trading experience!

AVAX ANALYSIS (12H TF)AVAX has been bullish for several days. By examining the waves, we found that AVAX is inside a complex pattern. In fact, AVAX is inside a large diametric, which is now inside wave E of this diametric. The E wave itself has rewrapped and formed a diametric that we are now inside the f wave of this diametric. In the red area, we expect the f wave from E to end and enter the g wave from E. In the following, we also specified the possible fluctuations.
For risk management, please don't forget stop loss and capital management
Comment if you have any questions
Thank You

AVAX/USDT 1DAY UPDATE BY CRYPTOSANDERS !!Hello friends, welcome to this AVAX/USDT update from Crypto Sanders.
Chart Analysis:- Avalanche (AVAX) made sizable gains to start the week, moving by as much as 6% higher during the day.
AVAX/USD peaked at 11.60 on Monday, which comes less than 24 hours after falling to a bottom at 10.92.
This has resulted in the avalanche rising to its strongest point since October 7, when the price last surpassed a ceiling at 11.70.
Earlier gains have marginally faded, with AVAX now sitting at 11.57, and this comes as the RSI hit a ceiling at 70.00.
Price strength is now hovering at 69.40, however, bulls will likely look to break this mark and force a move above 70.00 in the coming days.
I have tried to bring the best possible results in this chart.
If you like it, hit the like button and share your charts in the comments section.
Thank you.

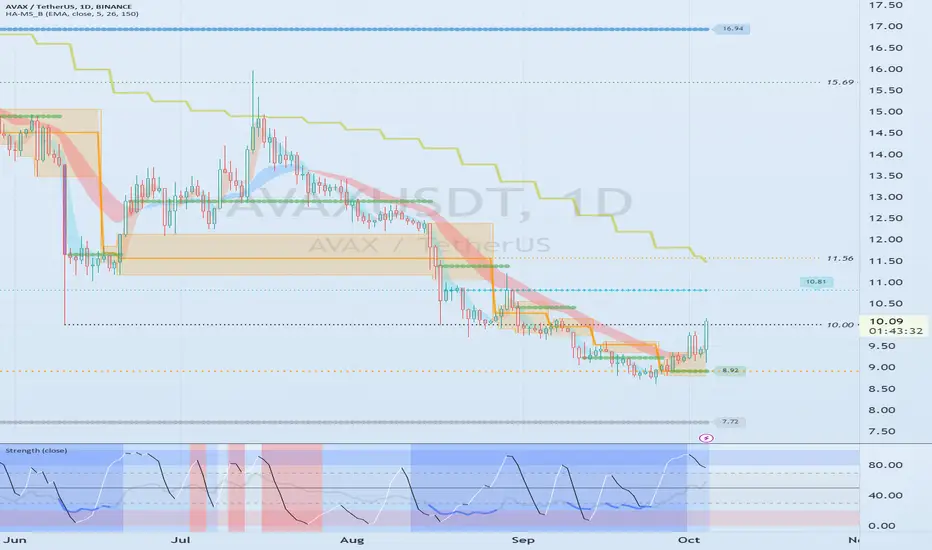
Box section : 8.81-10.09Hello?
Hello traders!
If you "Follow" us, you can always get new information quickly.
Please also click “Boost”.
Have a good day.
-------------------------------------
(AVAXUSDT chart)
The key is whether the price can be maintained by rising above 13.4704.
Therefore, from a long-term perspective, 13.4704 or lower can be considered the bottom range.
(1W chart)
The key is whether it can receive support and rise around 9.76.
At this time, what is important is whether the price can be maintained by rising above the MS-Signal indicator.
(1D chart)
You are looking at the 1M chart and the 1W chart, but you may be asking, is there a need to see the entire chart on the 1D chart?
The reason to view the 1D chart as a full chart is to see how support and resistance points are marked.
You can check support and resistance points through the 1W chart and 1M chart, but since they only show approximate points, it may be burdensome to use them in your trading strategy.
The only support and resistance point formed across the entire chart is the 7.72 point on the current chart.
Therefore, other support and resistance points can be said to be support and resistance points that are still being formed.
Therefore, this means that the role of support and resistance may be weak.
Therefore, AVAX can also be seen as a coin (token) that is likely to show a large upward trend whenever a full-fledged upward trend begins.
No matter how likely it is that there will be a big uptrend at any time, if the trading volume does not increase accordingly, it may be meaningless and should not be given much meaning.
The recent move caused the HA-High indicator to drop and create a new one.
Accordingly, the HA-Low indicator and the HA-High indicator are showing close proximity.
Accordingly, if it shows support in the 8.92-9.83 range, it seems likely that it will turn into an upward trend.
If we select the box section with this in mind, it falls within the 8.81-10.09 section.
Therefore, when the StochRSI indicator leaves the oversold range, the key is whether it shows movement out of the 8.81-10.09 range.
-------------------------------------------------- -------------------------------------------
** All explanations are for reference only and do not guarantee profit or loss in investment.
** Trading volume is displayed as a candle body based on 10EMA.
How to display (in order from darkest to darkest)
More than 3 times the trading volume of 10EMA > 2.5 times > 2.0 times > 1.25 times > Trading volume below 10EMA
** Even if you know other people’s know-how, it takes a considerable amount of time to make it your own.
** This chart was created using my know-how.
---------------------------------

AVAX/USDT 1DAY UPDATE BY CRYPTOSANDERS !!Hello, welcome to this AVAX/USDT 1DAY chart update by CRYPTOSANDERS.
CHART ANALYSIS:-Avalanche (AVAX) was a big mover on Friday, as the cryptocurrency rose by as much as 7% during the day.
Following a low of 9.85 on Thursday, AVAX/USD rose to a peak of 10.80 earlier in today’s session.
The move pushed the avalanche to its highest level since August 29, past a key price ceiling of 10.00 in the process.
the relative strength index (RSI) also escaped a resistance level of its own at 65.00.
price strength now resides at 68.54, which is its highest point since mid-April this year.
The next target for current buyers will likely be 11.00, however with the price now overbought, a reversal could also be on the cards.
This is not a piece of financial advice.
Hit the like button if you like it and share your charts in the comments section.
Thank you

Need to check if it can rise above 10.81Hello?
Hello traders!
If you "Follow" us, you can always get new information quickly.
Please also click “Boost”.
Have a good day.
-------------------------------------
(AVAXUSDT chart)
The key is whether the price can be maintained above 9.76 and rise above 13.47.
(1D chart)
It is supported and rising in the 8.81-9.36 range.
The key is whether it can rise above 10.81.
If it receives support in the 10.81-11.56 range, it is expected to lead to an upward movement to around 15.69-16.94.
If this is not the case and it falls below 8.92 and shows resistance, caution is needed as it is expected to fall to around 7.72.
-------------------------------------------------- -------------------------------------------
** All explanations are for reference only and do not guarantee profit or loss in investment.
** Trading volume is displayed as a candle body based on 10EMA.
How to display (in order from darkest to darkest)
More than 3 times the trading volume of 10EMA > 2.5 times > 2.0 times > 1.25 times > Trading volume below 10EMA
** Even if you know other people’s know-how, it takes a considerable amount of time to make it your own.
** This chart was created using my know-how.
---------------------------------
AVAX ANALYSIS (6H)Hi, dear traders. how are you ? Today we have a viewpoint to BUY/LONG the AVAX symbol.
We decided to send one of our arrows towards AVAX.
The green area is where you should ride this symbol, where you can ride the AVAX horses!
For risk management, please don't forget stop loss and capital management
When we reach the first target, save some profit and then change the stop to entry
Comment if you have any questions
Thank You

AVAX ANALYSIS (1D)Hi, dear traders. how are you ? Today we have a viewpoint to BUY/SELL the AVAX symbol.
For risk management, please don't forget stop loss and capital management
When we reach the first target, save some profit and then change the stop to entry
Comment if you have any questions
Thank You
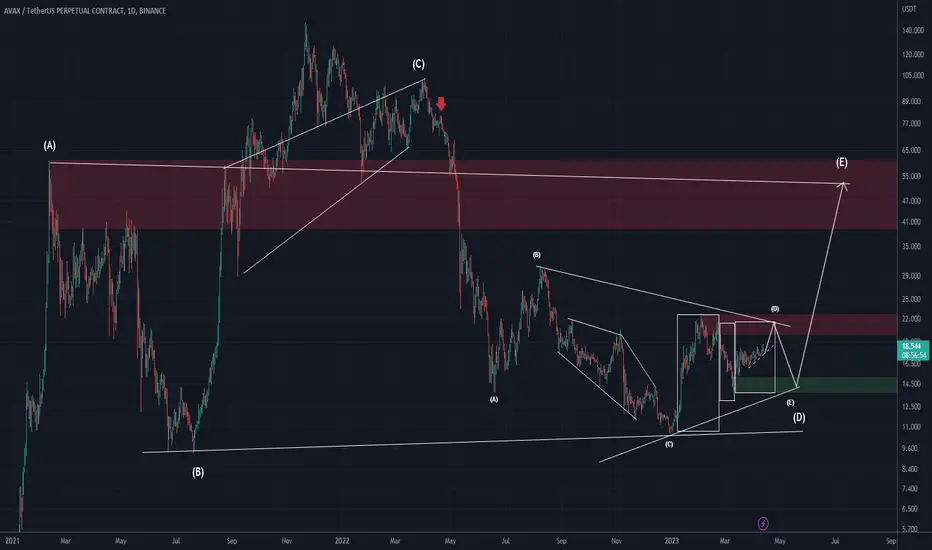
The 12.40-17.15 section is the buy sectionHello?
Traders, welcome.
If you "Follow", you can always get new information quickly.
Please also click "Boost".
Have a good day.
-------------------------------------
(AVAXUSDT chart)
Looking at the 1M chart,
A rise above 17.70 is expected to sustain the price before a full-fledged uptrend begins.
Looking at the 1W chart,
Currently, it is located in the section formed by the HA-Low indicator on the 1W chart.
Therefore, the key is whether it can rise with support in the current section.
However, since the HA-High indicator on the 1W chart is located nearby, it is not easy to actually buy.
The reason is that the resistance zones are so close together.
If the HA-Low and HA-High indicators are close together, you can see that they are converging as you can see by looking at the Bollinger bands.
Therefore, in this case, it is necessary to check whether it is supported or resisted in the section consisting of the HA-Low and HA-High indicators, and it corresponds to the buying section.
An upward breakout of the 19.73-23.96 zone is expected to release the converged forces.
To put the above 1M chart description and 1W chart description together,
If support is found at 17.70 on the 1W chart's HA-High indicator, it can be said that the uptrend is expected to begin.
Looking at the 1D chart,
The support and resistance points of the 1M, 1W, and 1D charts are combined in order of importance.
Therefore, many lines are drawn.
The interval of the HA-Low indicator on the 1W chart is the range of 12.40-13.83.
Therefore, if the price rises from support in this zone, it is more likely to break out of the downtrend line and continue the uptrend.
Accordingly, the key is whether the price maintains the price by rising above 13.83 based on the volatility period around July 15th.
If this is not the case and it declines, you should check for support near the HA-Low indicator on the 1D chart. (11.56-11.80)
The 14.99-17.15 section consists of the HA-High indicator on the 1W chart.
Therefore, it is expected that the price will turn into an uptrend only when it breaks above this section.
As I mentioned earlier, it is expected that a full-fledged uptrend will begin when the upward break of the 17.15-17.70 section and the 19.16-19.73 section.
-------------------------------------------------- -------------------------------------------
** All descriptions are for reference only and do not guarantee profit or loss in investment.
** Even if you know other people's know-how, it takes a considerable period of time to make it your own.
** This is a chart created with my know-how.
---------------------------------

AVAX on THIN ICEBankrupt exchange Voyager Digital to shut shop after failed deals, details inside
According to Voyager Digital’s lawyers, the crypto lender will self-liquidate its assets after failing to reach an agreement on a sale to either FTX US or Binance.US.
The announcement, shared in a court filing on 5 May, comes just ten days after Binance.US abruptly backed out of a $1 billion deal to buy Voyager Digital’s assets when the US government intervened to prohibit part of it.
Prior to the agreement with Binance.US, the crypto lender made a similar offer to FTX. When FTX went bankrupt alongside Voyager in November, the first contract was cancelled.
Voyager stated in a filing that a number of digital assets on the platform that cannot be removed will be liquidated and returned to its users. These assets include major cryptocurrencies such as Algorand , Celo and Avalanche .
Avalanche’s latest collaboration with Chinese company Alibaba could change the game for AVAX in the cryptocurrency market. At press time, the excitement of the partnership was reflected on the AVAX charts.
Avalanche managed to secure a major partnership that could make it a stronger contender in the metaverse.
AVAX sees low demand despite the hype around a new partnership and supports retest.
Avalanche could be about to spice things up in the metaverse thanks to a major development that might be a game-changer. The development in question is a partnership with Chinese tech giant Alibaba.
According to Avalanche’s official announcement, the two secured a partnership through which Avalanche will be the conduit for Alibaba’s metaverse pursuits.
The partnership will focus on Alibaba’s Cloudverse, the cloud computing segment of the Chinese company which already has millions of customers. Avalanche will provide the decentralized technology to support this metaverse endeavor.
Today, @alibaba_cloud announced that they are entering the metaverse--on Avalanche!
With Cloudverse, Alibaba Cloud's millions of clients can easily deploy custom metaverses and unlock new dimensions for consumers.
#Avalanche will provide all blockchain elements for Cloudverse
Today, @alibaba_cloud announced that they are entering the metaverse--on Avalanche!
With Cloudverse, Alibaba Cloud's millions of clients can easily deploy custom metaverses and unlock new dimensions for consumers.
#Avalanche will provide all blockchain elements for Cloudverse
One of the ways to tell if the excitement has been converted into strong demand is to evaluate on-chain volumes. AVAX on-chain volume experienced a slight upside in the last 24 hours, although likely not strong enough to support enough bullish excitement.
Despite the lack of strong demand within the first 24 hours after the announcement, there was one key factor that may still support a strong bounce. AVAX’s price action had been trading within a tight range after finding support near the $16.50 price range. More importantly, the price was recently pushed into an ascending support line.
The same support level may act as a bounce-off zone if AVAX can secure enough bullish demand in the next few days. Its MFI already pivoted after previously registering outflows. Weak bullish demand or a surge in sell pressure may also manifest in the market sentiment shifts in favor of the bears.

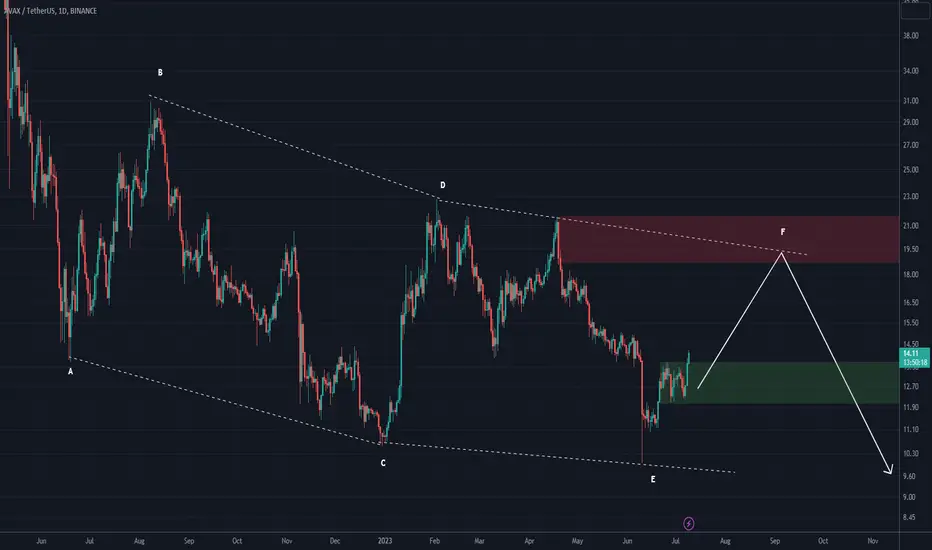
Avalanche to tumble southward as the downtrend persistsThe daily and 4-hour price charts of Avalanche showed the bears were highly likely to drive prices lower, especially after the move below $13.88 on 5 June.
The higher timeframe charts showed that the mid-April rally failed to break key highs.
This was followed by a downtrend in May, but the $13.8 area posed some opposition to the sellers.
Avalanche had a bearish bias on the price charts. It is the fifth largest blockchain in terms of TVL but its DeFi activity stagnated in recent months. In other news, SushiSwap announced the launch of their v3 suite of products on Avalanche.
The price action presented short sellers with an opportunity. The structure was bearish, but the volatility has been high over the past 48 hours despite seller dominance. If the prices fall beneath $13.5, it would represent a continuation of the downtrend.
The market structure was bearish on the daily timeframe, and a downtrend was in progress. The 4-hour chart also showed a downtrend in progress. In May, the price formed a series of lower highs and lower lows.
The $13.88 level served as support, but AVAX still formed a low at $13.71 on 25 May. On 5 June, the price fell to $13.48, showing that bears remained dominant. Despite the bounce to $14.6 on 7 June, the market structure remained bearish.
Monday’s move was used to plot a set of Fibonacci retracement levels (pale yellow). It showed the 78.6% retracement level at $14.62, which explained the inability of the bulls to drive prices higher. Having established the bearish character of the market, a short trade can be entered upon a retest of the 50% retracement level at $14.21.
The 23.6% and 61.8% Fibonacci extension levels at $13.14 and $12.58 can be used to book profits. A move by AVAX above $14.93 would invalidate this idea as it represents a key short-term lower high.
It has been noted that the prices bounced to the $14.62 level on Wednesday. Despite that, the spot CVD continued to decline. Over the past 24 hours, the metric was flat, this showed buyers were in the minority and selling pressure was overwhelming.
The Open Interest picked up a little, amounting to close to $10 million. However, when AVAX faced rejection at $14.6, the open interest dropped further. This development hinted at discouraged bulls. Overall, the bearish sentiment was prevalent both on the low and high timeframes.

AVAX ROADMAPIf price can stay above 14$ than next step will be 16$ around.
If price can not stay above 14$ than we can see 11$-12$ levels.
Take your risk, make some profit !

avaxusdt are you rdy ?🧨😉Avax currency
First, I must say that there should be a downward trend until the target of $10.79. The short trend for this currency is up to this target.
The upward trend for this currency has two attractive targets and the entry is $10.79, then the targets it will see will be $21.34 and the doom target will be $30.49.
All analyzes are done with the knowledge of banking transactions.

Avalanche AVAX to 19.99$ ?👑 #AVAX/USDT BUY 👑
Entry:
14.60✅
Targets:
1️⃣15.89🎯
2️⃣16.96🎯
3️⃣17.84🎯
4️⃣18.73🎯
5️⃣19.99🎯

avaxusdt DailyHi Guys Hope you well,
On May 28, the Avax token will be released, and about 3% of the circulating supply, equivalent to 327 million Avax tokens, worth 168 million dollars, will be unlocked.
The addition of this volume of tokens to the circulating supply increases the supply and can lead to a drop in the price,
In line with this release, K33 Research removed the Avax token from the list of top 30 currencies and announced that this decision was made due to the lack of inflation control of this project.
Hi Guys Hope you well, and good weekend.
As I show You the chart , It maybe a Wyckoff pattern, be careful for long position ,completely against the trend of bitcoin.
SecondChanceCrypto
⏰07/May/23
⛔️(DYOR)
always do your research.
If you have any questions, you can write them in the comments below, and I will answer them.
And please don't forget to support this idea with your likes and comment

AVAX UPDATE (1D)Hi, dear traders. how are you ? Today we have a viewpoint to BUY/SELL the AVAX symbol.
For risk management, please don't forget stop loss and capital management
When we reach the first target, save some profit and then change the stop to entry
Comment if you have any questions
Thank You
Volatility Period: April 19-21Hello?
Traders, welcome.
If you "Follow", you can always get new information quickly.
Please also click "Boost".
Have a good day.
** Analysis of the BTC chart publishes new ideas once a week.
** However, we publish new ideas when volatility occurs or when we show signs of diverging from our expectations.
** Excluding the above situation, BTC analysis is listed as a daily update.
-------------------------------------
(AVAXBTC 1W Chart)
The question is whether it can rise above 0.0009 187.
If not, we need to see if it finds support around 0.0006 306 and breaks out of the downtrend line.
-----------------------------------------------
(AVAXUSDT chart)
During the volatility period around April 20 (April 19-21), it is necessary to check whether it can show a move out of the 19.16-23.96 zone.
If not, it should be sideways in the 19.16-23.96 zone to confirm the next volatility period around the 15th of May.
-------------------------------------------------- -------------------------------------------
** All descriptions are for reference only and do not guarantee profit or loss in investment.
** Even if you know other people's know-how, it takes a considerable period of time to make it your own.
** This is a chart created with my know-how.
---------------------------------

To get out of the bottom section... (19.73 important)Hello?
Traders, welcome.
If you "Follow", you can always get new information quickly.
Please also click "Boost".
Have a good day.
-------------------------------------
(AVAXBTC 1W Chart)
The question is whether it can break out of the downtrend line by rising above 0.0007352.
------------------------------------------
(AVAXUSDT chart)
------------------------------------------
(AVAXUSDT 1W Chart)
If the price is maintained above HA-High, it is highly likely to continue its mid- to long-term upward trend.
Therefore, the key is whether it can rise above 19.73 and be supported.
If not, you should check if it is supported around the HA-Low indicator.
(1D chart)
The key is whether it can be supported around 17.15 and rise above 19.72.
If it fails, you should check for support around 14.99.
The 17.15 point is the HA-High indicator point on the 1W chart, so if the price is maintained above this point, it is highly likely to continue the mid- to long-term upward trend.
However, it needs to rise above 19.73 to continue the upward trend.
-------------------------------------------------- -------------------------------------------
** All descriptions are for reference only and do not guarantee profit or loss in investment.
** Even if you know other people's know-how, it takes a considerable period of time to make it your own.
** This is a chart created with my know-how.
---------------------------------

AVAXBTCAVAXBTC
AVAXBTC remains strong in the bearish channel and needs buying momentum to break out of it. It also has two great supports which are 6054 and 5902.
The BTC pairs have suffered a lot these last few days due to the increase in the dominance of the BTc which, as soon as it cools down, will rise again.
On a retreat from BTC dominance AVAXBTC goes to 7158 and after 8124.
RSI already indicating exhaustion of selling forces is a good sign!
BTC did not reach this value as of June 14, 2022

AVAX 100 % gains comingWe expect that the price will get rejected at the strong resistance ($21,600 - $22).
You can short it (stop loss recommended) or be patient and wait for a price to drop into our buy zone ($10-$11). From there we expect a pump towards strong resistance again which would be over 100 % gain.
Mid-term the market remains bearish overall .

Loco and Avalanche (AVAXUSDT)Loco's launch of LegendsByLoco on #Avalanche is a significant move for both the streaming platform and the #crypto coin. Avalanche is a well-established #cryptocurrency with a growing user base, and the #partnership with #Loco will likely drive even more adoption.
The launch of #LegendsByLoco on Avalanche is a significant development for Loco, as it allows users to participate in player-owned fantasy esports. This is a unique feature that sets Loco apart from other #streaming platforms, and it could help the company continue to dominate #India's streaming market.
Furthermore, the partnership with Avalanche gives Loco access to a reliable and secure blockchain platform that can handle high transaction volumes. Avalanche's consensus mechanism is designed to support high throughput and fast confirmation times, making it an ideal choice for Loco's fantasy esports platform.
Overall, Loco's partnership with Avalanche is a smart move that could help the company maintain its position as India's largest #video #game streaming #platform. With more than 50 million users and counting, Loco is well-positioned to take advantage of the growing interest in player-owned #fantasy #esports, and its partnership with Avalanche gives it a solid foundation on which to build.
Target zone: $37,90 - $41.00

AVAX/USDTIf this currency can cross the black range, it can climb up to $26.
But if Bitcoin falls and cannot maintain this range, I predict that this currency will correct itself from this range or even from the range of $22 to the range of $15.5 to $16.6 and then climb to the destination of $26. and start at $37
As you know, everything depends on Bitcoin and its every move is the decision maker of the overall market trend
