AVAX Avalanche Areas of SUPPORT/RESISTANCE BINANCE:AVAXUSDT
Hey ! Here ive charted out some KEY areas of support/resistance to keep an eye out for if you are trading this coin. These are VOLUME areas !
Not financial advice ! just my thoughts .
Lets gett this CRYPTO !!!
BINANCE:AVAXUSDT
AVAXBTC

AVAX AVALANCHE Price Analysis 4 HOUR CHART Hey there! here are some key levels of support/resistance to keep an eye on!
Pretty simple here.
SPREAD THE LOVE guys ! and stay safe out there!
GHHEEET THAT CRYPTO YO ! $$$
BINANCE:AVAXUSDT

AVAX IS STILL BULLISHHi, dear traders. how are you ? Today we have a viewpoint to BUY/LONG the AVAX symbol.
For risk management, please don't forget stop loss and capital management
When we reach the first target, save some profit and then change the stop to entry
Comment if you have any questions
Thank You

Need to check if it is supported around 16.65-17.91Hello?
Traders, welcome.
If you "Follow", you can always get new information quickly.
Please also click "Boost".
Have a good day.
Thanks for your feedback on the dark mode, I made the chart in black as much as possible to match the colors used in the chart.
Please leave your thoughts on this in the comments.
-------------------------------------
(AVAXBTC 1W Chart)
If it fails to rise above 0.0008 602, I would expect a sharp decline.
--------------------------------------
------------------------------------------
(AVAXUSDT 1W Chart)
The HA-High indicator is looking to be created on 17.15.
Therefore, the key is whether it can be supported around 17.15.
(1D chart)
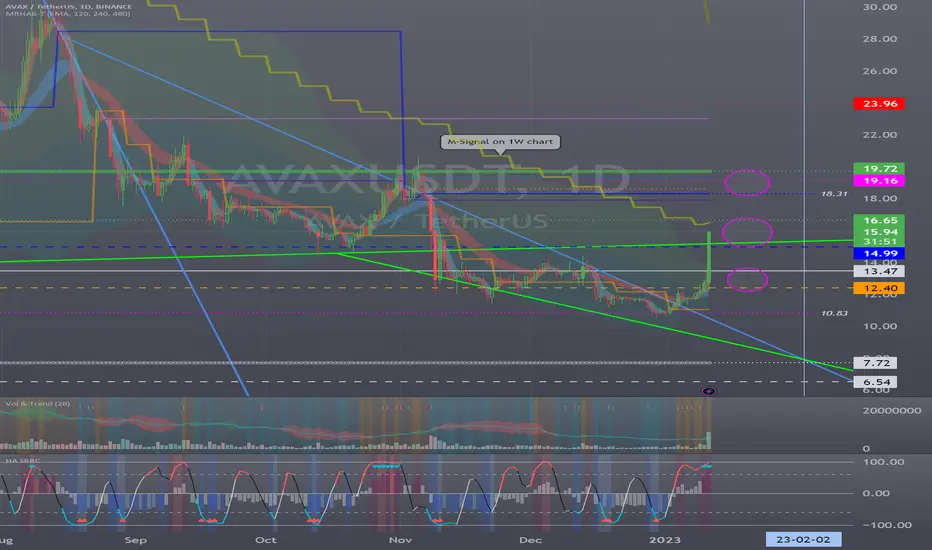
Being supported and able to rise around 16.65-17.91 is important.
If not, I expect it to decline around 13.47.
-------------------------------------------------- -------------------------------------------
** All descriptions are for reference only and do not guarantee profit or loss in investment.
** If you share this chart, you can use the indicators normally.
** The MRHAB-T indicator includes indicators that indicate points of support and resistance.
** Check the formulas for the MS-Signal, HA-Low, and HA-High indicators at ().
(Short-term Stop Loss can be said to be a point where profit or loss can be preserved or additional entry can be made by split trading. This is a short-term investment perspective.)
---------------------------------
AVAX Avalanche 4 HOUR Chart Here are my thoughts on AVAX at the moment.
AVAX is trading in this channel AND NEEDS to hold the SUPPORT at $17.33 IF IT wants to continue to the upside.
If AVAX can get above the 18$ lvl We could see the coin move up to test $19.26.$20-28 areas of resistance!
ON THE FLIPSIDE
IF Avax loses this support then we could see it go back down and test the $16.25 - $17.33 LVL

AVAX (Avalanche) 1 HOUR CHART Quick LONG setupGood day to everyone hope you are all doing great out there!
Here's a quick little setup idea..
Avax is in this channel and has touched the top of it 3 times now and could be going for the 4th.
ENTRY - 17.92 -18.12
TP #1 - 19.25
Tp #2 - 20.28
SL - 17.64


AVAX❄️ triangle breakoutAvalanche broke up this triangle📐 and I think there is chance for run to 19.43 and even higher. Setting BUY LIMIT order to previous range high to catch🎣 the pullback.
ENTRY : local high @ 17.34
STOPLOSS (SL) : local low @ 16.06
TARGET (TP) : height of the triangle projected from midpoint of the local range (BUY LIMIT - STOPLOSS) @ 19.43
REWARD RISK RATIO (RRR) : 1.63
INVALIDATION : when SL level hit
Check my other stuff in related ideas.
Please boost🚀, comment🗣️, follow me✒️, enjoy📺!
⚠️Disclaimer: I'm not financial advisor. This is not a financial advice. Do your own due dilingence.

Dynamic support of the channel's bottomUntil the dynamic support of the bottom of the channel is completely broken and confirmed, the price growth can continue ($20 resistance). But if the bottom of the channel is broken, a correction can be made to the support areas of $12.91 and $14.11.

AVAX/USDT 1DAY UPDATE BY CRYPTO SANDERS !!Hello, welcome to this AVAX/USDT 1DAY chart update by CRYPTOSANDERS.
I have tried to bring the best possible outcome to this chart.
Show some support, hit the like button, and follow and comment in the comment section. this motivates me to bring this kind of chart analysis on a regular basis.
CHART ANALYSIS:-Avalanche (AVAX) rose by as much as 22% in today’s session, as cryptocurrencies reacted to the latest U.S. inflation report.
AVAX/USD moved to a peak of $16.11 earlier in the day, which comes less than 24 hours after falling to a bottom of $12.41.
Thursday’s spike in price pushed avalanche to its highest point since November 8, when the price was at a peak of $18.15.
Looking at the chart, earlier gains have somewhat eased, with AVAX now trading at $15.18.
This came as the 14-day relative strength index (RSI) failed to break out from resistance at the 80.00 level.
As of writing, the index is now tracking at 69.94, which is still deep in overbought territory.
This is not a piece of financial advice.
Hit the like button if you like it and share your charts in the comments section.
Thank you

Avalanche Analyze (Short term, Timeframe 4H, 01/03/2023)!!!Avalanche was able to make a double-bottom pattern on the heavy support zone.
I expect Avalanche will go up at least until the middle line of descending channel and resistance zone.
Avalanche Analyze ( AVAXUSDT ) Timeframe 4h⏰ (Log Scale).
Do not forget to put Stop loss for your positions (For every position that you want to open).
Please follow your strategy, this is just my idea, and I will be glad to see your ideas in this post.
Please do not forget the ✅' like '✅ button 🙏😊 & Share it with your friends; thanks, and Trade safe.

Buying pressureAVAX has recorded a 25% gain in the last 24 hours. Buying pressure and increased demand have led to the failure of two important static resistances. The first resistance at $13 has now turned into good support. But the power of the buyer is so high that the possibility of a pullback to this support area has decreased. But another support is in the $13.8-$14.20 range, where a return to this level could trigger higher targets for AVAX if there is a positive reaction. The target we can consider for Avax is in the range of 21-22 dollars.

In order to transition to a mid- to long-term uptrend...Hello?
Traders, welcome.
If you "Follow", you can always get new information quickly.
Please also click "Boost".
Have a nice day.
-------------------------------------
(AVAXBTC 1W Chart)
AVAX, one of the coins that are expanding the coin ecosystem, is rising to a section where it is likely to emit the power of rising.
If it rises above 0.0009 187, it is judged that there is a possibility of exploding the power of the rise.
------------------------------------------
(AVAXUSDT 1W Chart)
It shows a movement out of the volume profile section of 6.54-13.47.
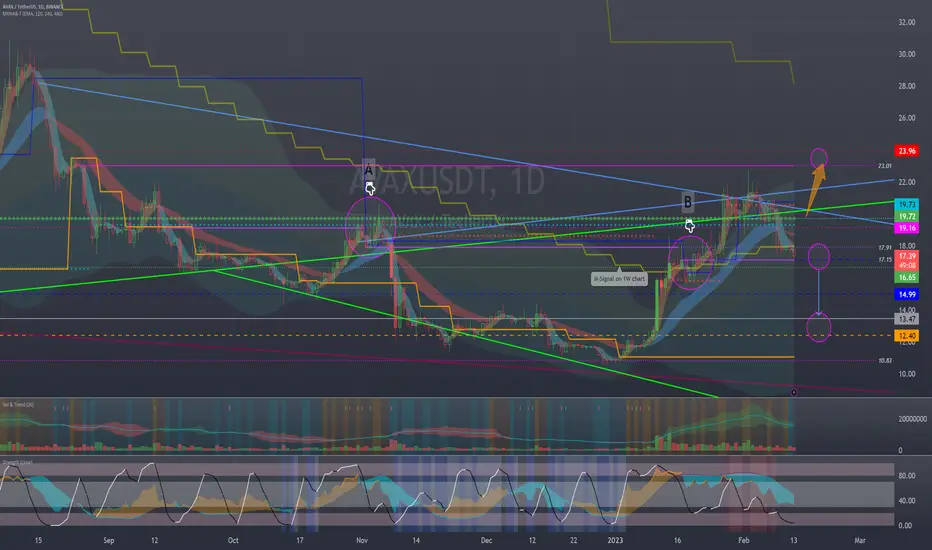
If the price rises above the MS-Signal and maintains the price, there is a high possibility that it will turn into an upward trend from a mid- to long-term perspective.
(1D chart)
The key is whether it can rise above 19.72 with support in the 14.99-16.65 section.
If not, you should check if the price holds within the 12.40-13.47 zone or higher.
Since the M-Signal on the 1W chart is formed around 16.65, it is important whether it can rise above 16.65.
-------------------------------------------------- -------------------------------------------
** All descriptions are for reference only and do not guarantee profit or loss in investment.
** If you share this chart, you can use the indicators normally.
** The MRHAB-T indicator includes indicators that indicate points of support and resistance.
** HA SRRC indicators are displayed as StochRSI (line), RSI (columns), and CCI (bgcolor).
** The CCI indicator is displayed in the overbought section (CCI > +100) and oversold section (CCI < -100).
(Short-term Stop Loss can be said to be a point where profit or loss can be preserved or additional entry can be made by split trading. This is a short-term investment perspective.)
---------------------------------
The point to be supported is...Happy new year!
Traders, welcome.
If you "Follow", you can always get new information quickly.
Please also click "Boost".
Have a good day.
-------------------------------------
(AVAXBTC 1W Chart)
In order to dissipate the rising force, it must rise above 0.008 602 ~ 0.0009 187.
--------------------------------------
(AVAXUSDT 1M Chart)
The key question is whether the price can sustain its rise above 13.47.
If not, it is better to wait until HA-Low is created in the long term.
(1W chart)
If it continues to decline along the downtrend channel, there is a possibility of a decline to around 6.54, so we need to think about countermeasures.
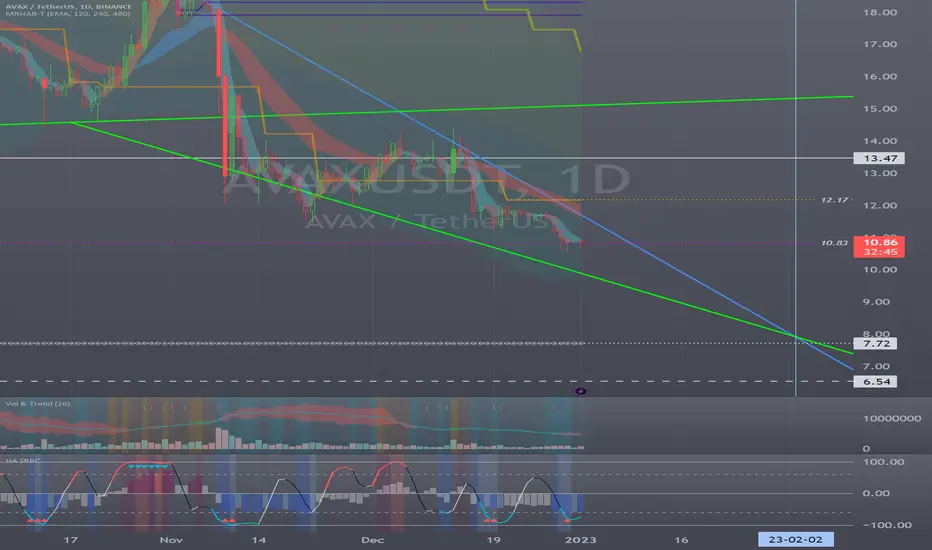
(1D chart)
The question is whether it can break out of the downtrend channel by moving sideways around 10.83.
If not, a decline to around 7.72 is likely.
-------------------------------------------------- -------------------------------------------
** All descriptions are for reference only and do not guarantee profit or loss in investment.
** If you share this chart, you can use the indicators normally.
** The MRHAB-T indicator includes indicators that indicate points of support and resistance.
** HA SRRC indicators are displayed as StochRSI (line), RSI (columns), and CCI (bgcolor).
** The CCI indicator is displayed in the overbought section (CCI > +100) and oversold section (CCI < -100).
(Short-term Stop Loss can be said to be a point where profit or loss can be preserved or additional entry can be made by split trading. This is a short-term investment perspective.)
---------------------------------
AVAX ANALYSIS#AVAX UPDATE.
#AVAX is facing huge resistance at the red box resistance area and got rejections on 4 TF.The current resistance for avax is the 20SMA on BB .The contraction of the BB suggesting some strong and flash move waiting ahead for avax .Do not enter in longs until avax close above the red box resistance.

AVAX analysis 1HI hope you are fine
Probably one up and then we will enter again. The fall will be deep. If it reaches a high point, short positions will be safer. It's just a deep breath to keep falling
Comment if you have any questions
Thank You

AVAX/USDT 1DAY UPDATE BY @CRYPTOSANDERS !!Welcome to this quick AVAX/USDT analysis.
I have tried my best to bring the best possible outcome in this chart.
Reason for Analysis:-Avalanche (AVAX) was a notable gainer on Tuesday, as prices surged following the release of U.S. inflation figures.
November’s consumer price index (CPI) came in at 7.1%, which was lower than the 7.3% traders were expecting.
As a result, AVAX/USD rallied to an intraday high of $14.09, which saw prices up by nearly 10%.
Today’s rise saw the avalanche hit its strongest point since December 5, which was the last time the token was trading above its ceiling at $13.75.
The 14-day relative strength index (RSI) also rose, breaking out of a resistance point of 51.50 in the process.
Gains in AVAX have eased from earlier highs, and as of writing the token is trading at $13.94.
Remember:-This is not a piece of financial advice. All investment made by me is at my own risk and I am held responsible for my own profit and losses. So, do your own research before investing in this trade.
Hit the like button if you like it and share your charts in the comments section.
Thank you...

Avalanche Analyze (Short term, Timeframe 4H, 12/05/2022)!!!
Avalanche was able to reach the resistance zone by zigzag correction.
The sign of the end of the zigzag correction is the creation of two Shooting Star Candlestick Patterns in the resistance zone.
I expect Avalanche will go down at least until the support zone after breaking the uptrend line.
Avalanche Analyze (AVAXUSDT) Timeframe 4h⏰ (Log Scale).
Do not forget to put Stop loss for your positions (For every position that you want to open).
Please follow your strategy, this is just my idea, and I will be glad to see your ideas in this post.
Please do not forget the ✅' like '✅ button 🙏😊 & Share it with your friends; thanks, and Trade safe.

Buying is risky because it is close to the resistance zoneHello?
Traders, welcome.
If you "Follow", you can always get new information quickly.
Please also click "Boost".
Have a good day.
-------------------------------------
(AVAXBTC 1W Chart)
If it is supported and rises in the range of 0.0007 164 to 0.0009 769, it is expected to release the power of the rise.
----------------------------------------
(AVAXUSDT 1W Chart)
It is important to be able to rise to the 15.44-20.30 section and be supported.
To do that, we need to see if we can get support around 13.47.
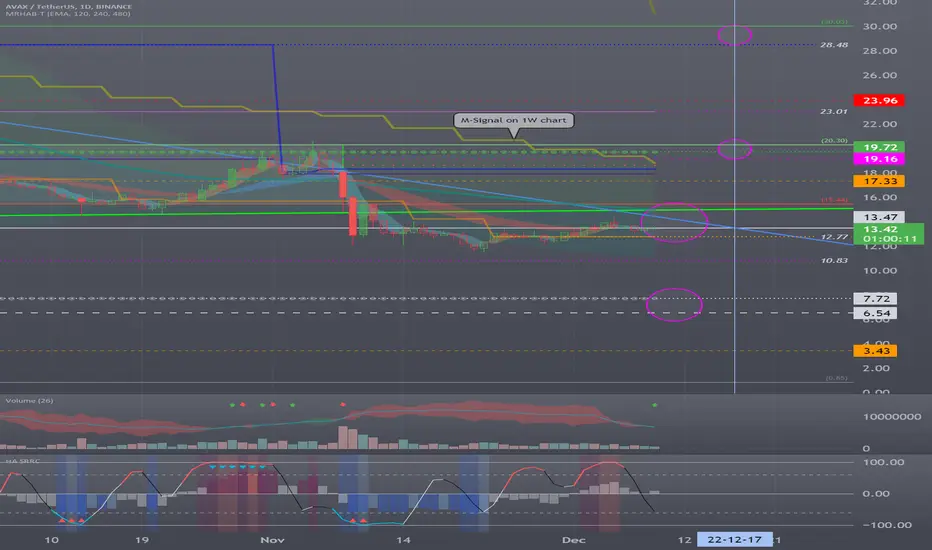
(1D chart)
It's a matter of being supported in the 12.77-13.47 section or higher and being able to rise above 15.44.
If not, you should be careful as there is a possibility that you will be forced to move around 6.54.
The 15.44-20.30 section is the section that determines the trend, and if it is supported and rises in this section, it is likely to continue the uptrend.
That said, the 15.44-20.30 section is a section with strong support and resistance, so be careful buying.
-------------------------------------------------- -------------------------------------------
** All descriptions are for reference only and do not guarantee profit or loss in investment.
** If you share this chart, you can use the indicators normally.
** The MRHAB-T indicator includes indicators that indicate points of support and resistance.
** HA SRRC indicators are displayed as StochRSI (line), RSI (columns), and CCI (bgcolor).
** The CCI indicator is displayed in the overbought section (CCI > +100) and oversold section (CCI < -100).
(Short-term Stop Loss can be said to be a point where profit or loss can be preserved or additional entry can be made by split trading. This is a short-term investment perspective.)
---------------------------------
AVAX's chart has become very similar to the Bitcoin's!AVAX has gained in price over the past week in the 4-hour time frame. According to the divergences formed on the RSI indicator and the breaking of the resistance of the downward trend line, as expected, the price of Avax had good growth up to the range of $13.3. But we can clearly see a range area in the 4-hour timeframe. A resistance was considered for Awax last week in the range of $13.26-$13.45, which has seen a negative reaction, with the price closely touching this area.
Also, a support area in the range of $12.4 to $12.7 is considered on the chart, and the price is ranging between these levels. In the 1-hour time frame, the AVAX chart has become very similar to the Bitcoin chart. Therefore, considering this high correlation, we can better understand the behavior of Awax by considering the movement behavior of Bitcoin. If Bitcoin continues its upward movement, Avax could break the current resistance to the $14.8-$15 level. This resistance overlaps with the midline of the Avax descending channel, and the probability of a negative reaction at this level is high.

Avalanche (AVAX) - November 24Hello?
Traders, welcome.
If you "Follow", you can always get new information quickly.
Please also click "Boost".
Have a good day.
-------------------------------------
(AVAXBTC 1W Chart)
In order to get the power to rise, it must be supported in the range of 0.0007 164 to 0.0009 769.
---------------------------------------
(AVAXUSDT 1W Chart)
The 15.44-20.30 interval is the one that determines the trend.
Therefore, it is important to be supported by rising to the 15.44-20.30 section.
However, the 13.47 point is the volume profile section, and if resistance is received at 13.47, there is a possibility of falling to around 6.54, so you need to think about countermeasures.
(1D chart)
It will be important if the price can quickly rise above 13.47 and sustain the price.
If this is not the case, it may lead to further declines, so cautious trading is required.
-------------------------------------------------- -------------------------------------------
** All descriptions are for reference only and do not guarantee profit or loss in investment.
** If you share this chart, you can use the indicators normally.
** The MRHAB-T indicator includes indicators that indicate points of support and resistance.
** SR_R_C indicators are displayed as StochRSI (line), RSI (columns), and CCI (bgcolor).
** The CCI indicator is displayed in the overbought section (CCI > +100) and oversold section (CCI < -100).
(Short-term Stop Loss can be said to be a point where profit or loss can be preserved or additional entry can be made by split trading. This is a short-term investment perspective.)
---------------------------------

Avalanche (AVAX) - November 10Hello?
Welcome, traders.
By "following", you can always get new information quickly.
Please also click "Boost".
Have a good day.
-------------------------------------
(AVAXBTC 1W Chart)
The key is whether the 0.007164-0.009769 zone can support and move up.
If the price holds above 0.009187, it is expected to dissipate strength.
-----------------------------------------
(AVAXUSDT 1W Chart)
The key is whether it can be supported by rising to the 15.44-20.30 section.
To do that, we need to see if it can rise above 13.47.
(1D chart)
The key is whether it can rise above 13.47 and find support.
If it doesn't, there is a possibility that it will move towards the 7.72 area, so be careful.
------------------------------------------------------------ -------------------------------------------
** All descriptions are for reference only and do not guarantee a profit or loss in investment.
** If you share this chart, you can use the indicators normally.
** The MRHAB-T indicator contains indicators that indicate support and resistance points.
** SR_R_C indicators are displayed as StochRSI(line), RSI(columns), CCI(bgcolor).
** CCI indicator is expressed as overbought range (CCI > +100) and oversold range (CCI < -100).
(Short-term Stop Loss can be said to be a point where profit and loss can be preserved or additional entry can be made through split trading. It is a short-term investment perspective.)
---------------------------------

AVAXusdt 6H in the channel In the chart, we see an ascending channel, if the bottom of the channel is maintained, we expect the price to rise to the top of the channel, and otherwise, we will see a drop to the support areas by losing the channel.
Its not Buy or Sell SIGNAL
DYOR
BY : M.TeriZ - @AtonicShark
