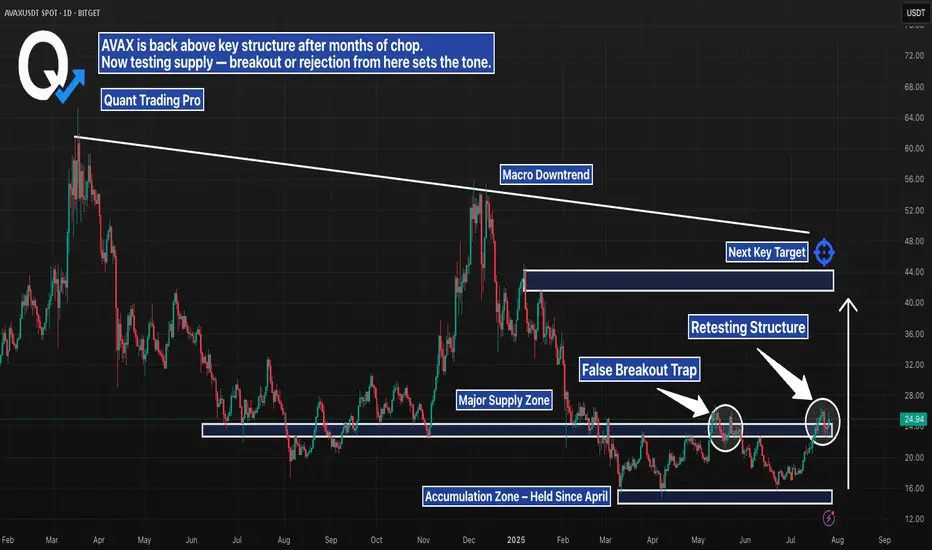
AVAX Daily – Breakout or Another Trap?AVAX just pushed into a major supply zone, testing structure that’s capped price since early 2024. After months of chop and accumulation, bulls have finally reclaimed key support — but the real test is happening now.
Here’s the setup:
– Retesting structure after first rejection
– Sitting below a clear macro downtrend line
– Above an accumulation zone that held for months
– Next key target sits near $40–44, with confluence from prior highs and trendline resistance
This is the kind of move that either builds serious momentum — or turns into another trap. Wait for confirmation. Volume and reaction here will say everything.
#AVAX #Altcoins #CryptoBreakout #SupplyZone #TrendlineResistance #TechnicalAnalysis #QuantTradingPro #PriceAction
AVAXUSD
Avalanche corrected from resistance ┆ HolderStatBINANCE:AVAXUSDT broke below $27.6 and is testing $25.9. Breakdown may open $24.5. Bears remain in control.
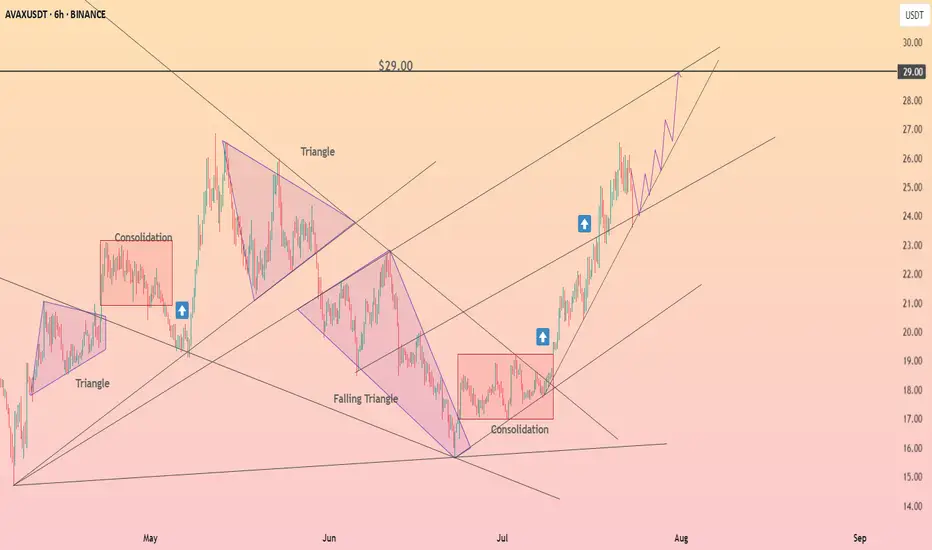
AVAX/USDT Trade Setup: Bullish Bias with Fibonacci Targets🚀 AVAX/USDT Avalanche is currently in a strong bullish trend 🔼. On the 4H chart, price is pulling back slightly 📉, and I’m watching for momentum to pick up and break above the current range high 📊—that’s where I’ll be looking for the next entry.
🎯 My bias remains long, and in the video I break everything down in detail:
🔍 Price action
🧱 Market structure
📈 Overall trend
📍 Stop loss placement (below the previous swing low)
🎯 Targeting key Fibonacci levels
I also go over my exact Fibonacci settings and how I use them to frame the trade.
This is not financial advice ❌💼

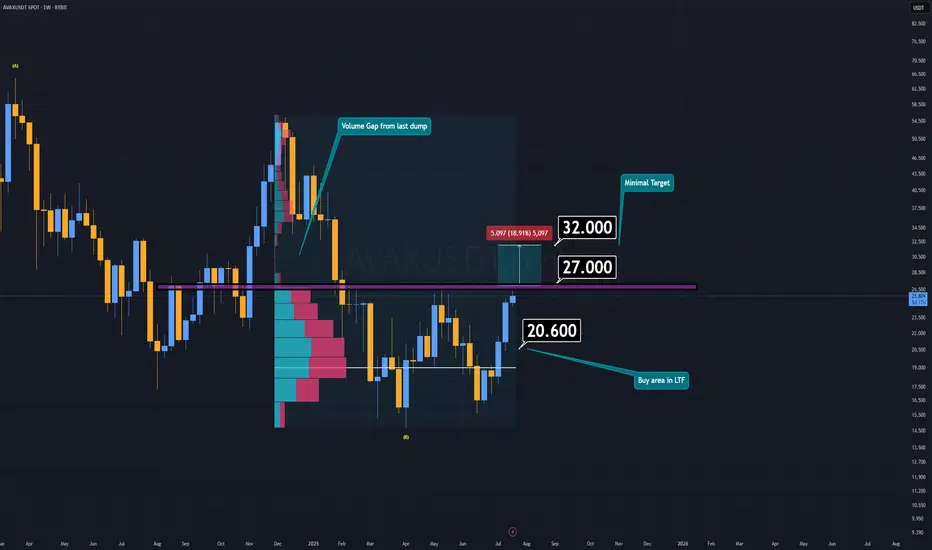
AVAX Analysis (1W)AVAX is currently attempting to form a double bottom pattern, which could signal a strong bullish reversal if confirmed. Earlier this week, AVAX made an effort to break down the key support/resistance zone, but it lacked the necessary volume to succeed.
If AVAX manages to reclaim the resistance area around $27 or higher, and confirms the breakout with a daily candle retest, the minimum target sits at $32.
However, if AVAX fails to break through resistance, there’s potentially an even better buying opportunity in the lower timeframes—a demand zone between $20 and $20.6.
I believe altcoins will offer another chance to catch up while prices are still far below their future valuations.
-S Wishes you the best in luck.
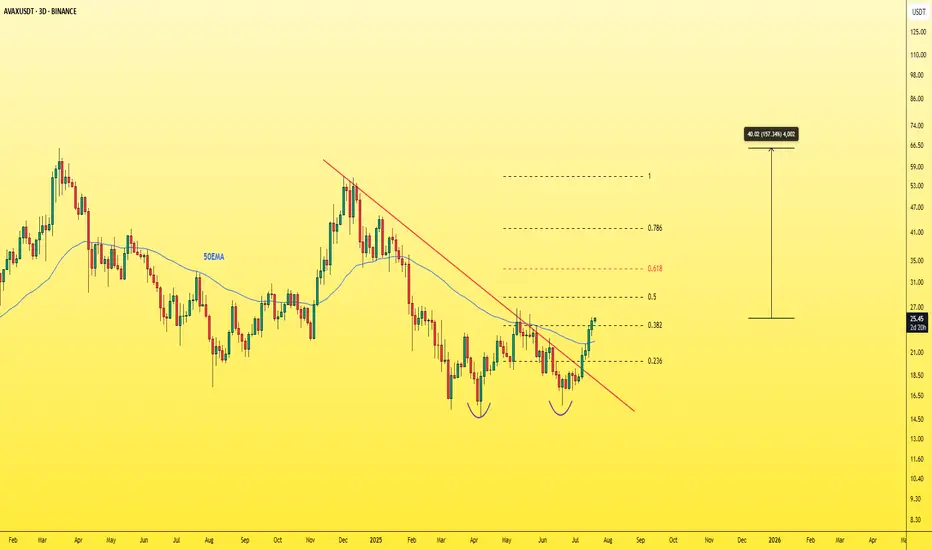
AVAXUSDT - THE real treasure must be hunted!Let's not forget about CRYPTOCAP:AVAX — it's one of the must-have assets in any crypto portfolio.
Currently trading at a discounted price after dropping from its previous top at $55, AVAX now shows strong bullish potential with plenty of upside ahead.
🚀 Key bullish signs:
-Successfully broke through multiple resistance levels, including the 0.382 Fibonacci retracement, 50 EMA, and the main descending trendline.
-A daily close above the 26$ level is a very positive signal.
With a solid project, reliable fundamentals, and low risk compared to potential reward, this could be a highly profitable opportunity.
Don’t sleep on it.🎯
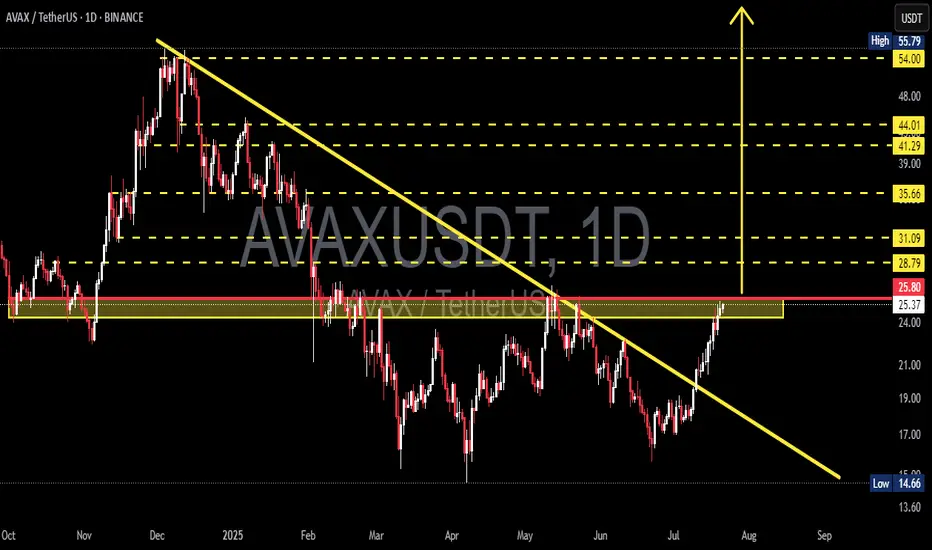
AVAX/USDT Massive Trend Reversal: Breakout from 8-Month DowntrenAVAX has just delivered one of its most technically significant moves in recent months. After spending over 8 months trapped under a descending resistance line, price action has finally broken free — suggesting a potential trend reversal and the beginning of a much larger bullish phase.
🧠 Pattern & Structure Breakdown:
📌 Descending Trendline Breakout
AVAX had been forming a descending triangle pattern, characterized by consistent lower highs and a horizontal support zone between $14.66 – $22. The recent bullish breakout from this structure, accompanied by strong volume, is a highly encouraging sign for bulls.
📌 Accumulation Zone Identified
The yellow zone on the chart ($14.66 – $22) has proven to be a strong demand zone where buyers consistently stepped in. The recent rally originates from this base, indicating possible institutional accumulation.
📌 Critical Horizontal Resistance at $25.80
Price is now testing the $25.80 resistance zone, which historically acted as a supply area. A successful daily close and confirmation above this level would officially flip the structure bullish.
📈 Bullish Scenario – Multi-Level Upside Targets:
If AVAX confirms the breakout above $25.80, these are the key bullish targets ahead:
🎯 Target 1: $28.79 – minor resistance & potential short-term TP zone
🎯 Target 2: $31.09 – previous price equilibrium
🎯 Target 3: $35.66 – key pivot from past market structure
🎯 Target 4: $41.29 and $44.01 – heavy historical supply zones
🎯 Target 5 (measured move): $54.00 to $55.79 – the projected breakout target from the descending triangle pattern
This move would represent a full technical recovery if AVAX aligns with broader market sentiment and Bitcoin remains stable or bullish.
📉 Bearish Scenario – Pullback Risks:
On the flip side, if price fails to sustain above $25.80 and gets rejected:
⚠️ A retest of $24.00 – $22.00 is likely
⚠️ If that zone breaks down, next support lies at $19.00 – $17.00
⚠️ A loss of the $17 level may trigger a return to the critical low near $14.66
This would invalidate the bullish breakout and return AVAX into a sideways or downward consolidation phase.
🔍 Additional Technical Insights:
✅ Volume is steadily increasing — showing renewed buying pressure
✅ Indicators like RSI and MACD (if applied) are likely showing bullish divergence
✅ Overall altcoin sentiment is improving, providing a tailwind for AVAX's potential breakout continuation
🧩 Final Thoughts:
AVAX is at a pivotal moment in its medium-term price structure. The breakout above the long-term downtrend line is a strong technical shift. A confirmed breakout and hold above $25.80 could trigger a multi-week or multi-month rally targeting $40 – $55+.
However, traders should be cautious of possible pullbacks and manage risk accordingly — especially as resistance zones from previous structures are being tested.
#AVAX #AVAXUSDT #CryptoBreakout #TechnicalAnalysis #Altcoins #BullishCrypto #DescendingTriangle #ReversalPattern #AVAXAnalysis
AVAXUSDTWe are bear-trend but wait for break trendline and pollback to 18.50$.
BINANCE:AVAXUSDT
Support: 16.90
Resistance: 18.50 - 21.30 - 25.50
⚠️Control money management.

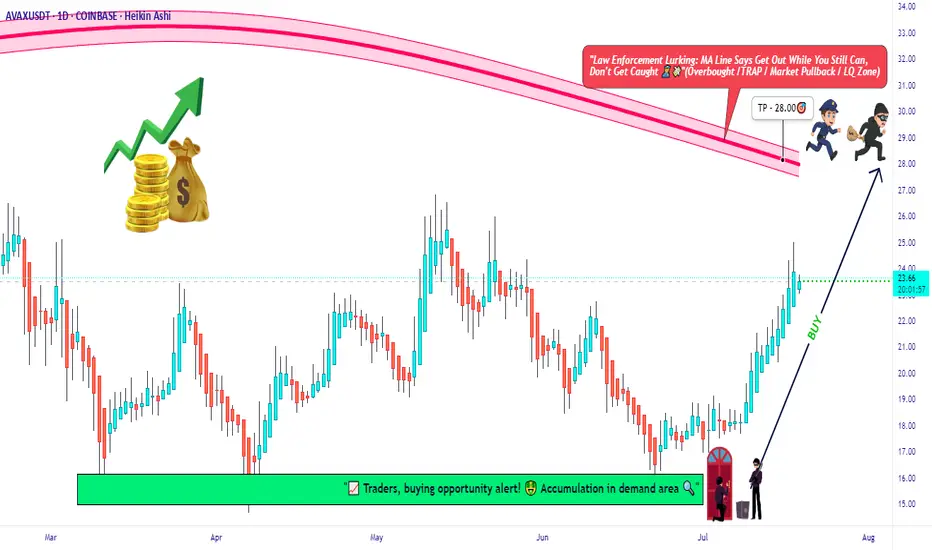
AVAX Long Only | Moving Average Trap Heist in Action🧨“Avalanche Crypto Vault Break-In 💣 | Thief Trader’s Long Playbook”⚔️💸🚀
(AVAX/USDT Crypto Heist Plan – Swing/Day Trade Blueprint)
🌍 Hi! Hola! Ola! Bonjour! Hallo! Marhaba! 🌟
Welcome, Money Makers, Market Pirates, and Chart Snipers! 🤑💰💼✈️
This ain’t just another setup — this is a strategic crypto ambush on AVAX/USDT, cooked up with the 🔥 Thief Trading Playbook 🔥. We're planning a clean, no-fingerprint heist into the Red Moving Average Zone. That’s the liquidity vault, and yes — the police (market makers) are watching 👮♂️🚨... but so are we. Stay sharp. 💼🔦
💥 Mission Objectives:
🎯 Entry Point (The Infiltration Point)
"The vault's wide open! Swipe the Bullish loot at any decent price" 📈
Smart thieves wait for pullbacks on the 15m or 30m chart to plant their limit orders near swing lows/highs. Use layered orders (DCA style) to scale in like a pro. 💣🔁
🛑 Stop Loss (Your Getaway Exit)
Secure your trade. SL at the nearest wick low/high on the 1D timeframe (around 21:00 candle).
Your SL = your personal risk code. Choose it based on lot size & how deep you're inside the vault. 🎭🚫
🏴☠️ Take Profit Target (The Treasure Room)
🎯 Target: 28.00 USDT
...or escape early if the heat (volatility) gets too intense. Protect the bag. 💼💰
⚡ Special Note for Scalpers:
🧲Only operate on the Long Side.
If you’ve got deep pockets, smash in directly. Otherwise, ride with swing bandits. Use trailing SL to secure stolen profits. 🧨📉📈
🔍 Market Heat Map & Rationale:
The AVAX/USDT setup is flashing bullish strength, backed by:
🧠 On-Chain Metrics 📊
💡 Market Sentiment
📰 Macro Catalysts
🌐 Intermarket Synchronicity
📡 Go grab the full breakdown on:
⚠️ Red Alert: News Zones Ahead! 📰🚫
Avoid fresh trades during high-volatility news releases.
Lock in gains with trailing SL. Risk management is not optional — it’s the escape vehicle. 🚗💨
📝 Legal Talk (Don’t Skip):
This isn’t investment advice. Just a well-planned blueprint from a market thief.
You're responsible for your own loot and losses. 🎭📉📈
❤️ Boost the Brotherhood 💥
Smash the 🔥BOOST BUTTON🔥 if you found value.
Every boost powers our Thief Trading Gang’s next big score. 🚀💸
Stay tuned for the next heist plan. I’ll be back with more charts, more loot, and less mercy. 🐱👤📊💥
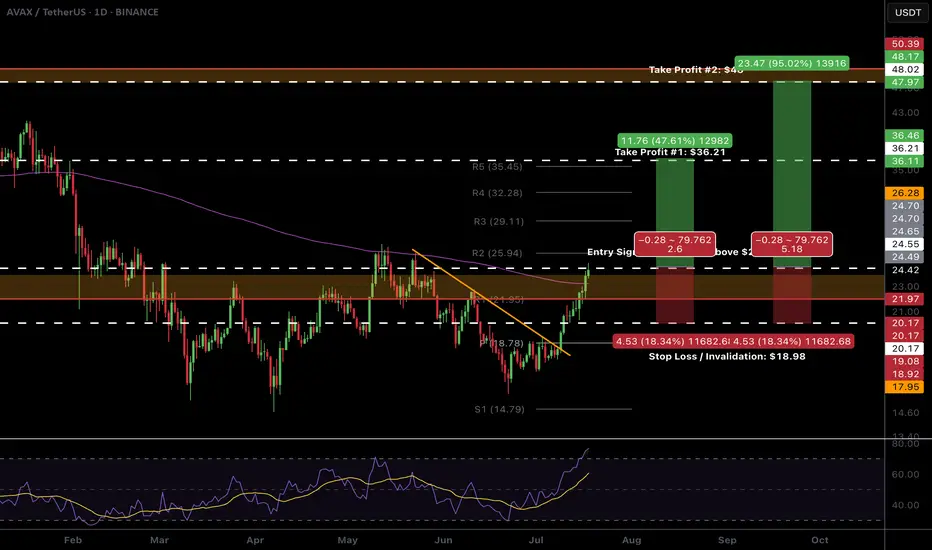
$AVAX Ready to breakout!CRYPTOCAP:AVAX looks ready to pop.
High Volume Node resistance and daily 200EMA is clear and now support. We don't want to see price rejected and moving back below this area.
The R5 daily pivot is my first partial take profit $35-36 followed by the major resistance High Volume Node at $48
Daily RSI is overbought with unconfirmed bearish divergence so watch out for this but should be good to run in the mean time. BTC permitting...
Safe trading
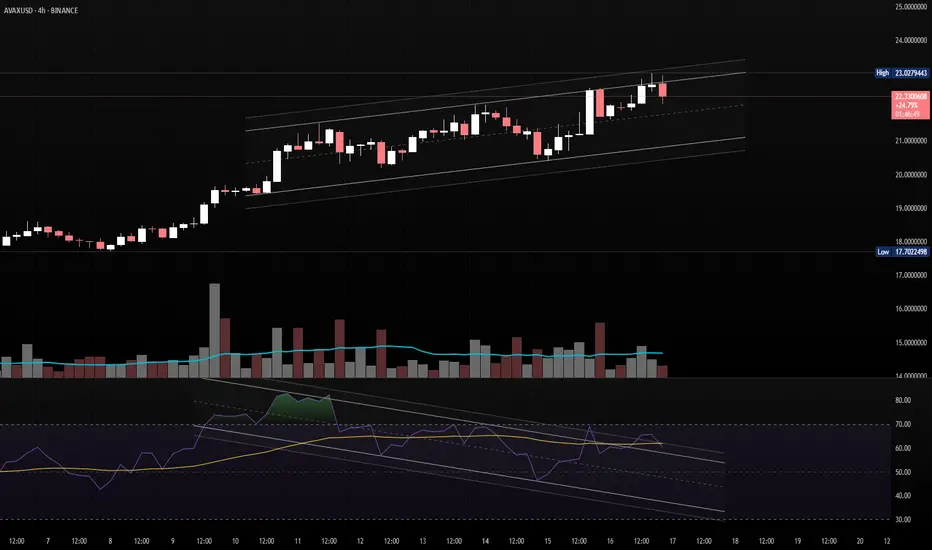
AVAXUSD - Possible Correction from Channel ResistanceStructure: Ascending Channel
Indicators: RSI Overbought, Bearish Divergence Forming
📌 Confirmation:
Look for:
A strong bearish candle or
RSI breaking below 60
Volume divergence
Bias: Short-term bearish correction, bullish structure intact as long as price holds the channel.
AVAX/USDT - H4 - Wedge Breakout (29.06.2025)The AVAX/USDT pair on the H4 timeframe presents a Potential Buying Opportunity due to a recent Formation of a Wedge Breakout Pattern. This suggests a shift in momentum towards the upside and a higher likelihood of further advances in the coming Days.
Possible Long Trade:
Entry: Consider Entering A Long Position around Trendline Of The Pattern.
Target Levels:
1st Resistance – 21.77
2nd Resistance – 24.35
🎁 Please hit the like button and
🎁 Leave a comment to support for My Post !
Your likes and comments are incredibly motivating and will encourage me to share more analysis with you.
Best Regards, KABHI_TA_TRADING
Thank you.

HolderStat┆AVAXUSD retest of trend lineBYBIT:AVAXUSDT has climbed steadily through a falling channel breakout and now trades firmly above $20.50. With triangle breakouts behind it, the next likely zone is $24–$25. Price action is aligning with bullish continuation patterns.

HolderStat┆AVAXUSD seeks to the $20OKX:AVAXUSDT is coiling inside an ascending triangle with resistance at 19.96. If this level is broken, price may rally toward 21.00 and beyond, supported by strong structure and repeated bullish formations.

HolderStat┆AVAXUSD decline from the trend lineBYBIT:AVAXUSDT has reclaimed key support near 17.63 USDT and is testing the $20 barrier after bouncing from a falling channel. The structure is bullish with higher lows forming. If price breaks above $20, the next target lies toward 25 USDT.

HolderStat┆AVAXUSD seeks to retest $17BINANCE:AVAXUSDT is pushing upward after a breakout from the falling channel structure, reclaiming the $17 support area. The short-term projection points toward $19, with upside potential toward $22 if the channel resistance breaks. Momentum is building from the breakout zone.

AVAX (Avalanche) Breakout? Here’s My Trade Plan.📊 Market Breakdown: AVAX/USDT (Avalanche)
Currently monitoring AVAX/USDT, and both the daily and 4-hour timeframes are showing a clear bullish break in market structure — a key signal that the momentum may be shifting to the upside.
That said, I’m not jumping in just yet. I’m only looking for long opportunities if specific criteria are met:
✅ A clean break above a key resistance level
✅ A retest of that level, followed by a failed attempt to move lower
If these conditions are confirmed, I’ll be watching for a high-probability entry from that zone.
🎥 In the video, I also walk through how to use several powerful TradingView indicators, including:
Volume Profile
VWAP
These tools help sharpen the edge and support decision-making in live market conditions. If the setup doesn’t materialize as expected, we simply stand aside — discipline is key.
📌 Disclaimer: This is not financial advice, just a breakdown of how I approach this potential opportunity.

AVAX/USDT Weekly Reversal Zone — Major Support Holding
🟨 CRITICAL ZONE (Key Support Area)
AVAX is currently trading within a major demand zone between $13.5–17.5, a historically strong support area that previously acted as the base for significant upward movements. Multiple weekly candles show rejection from this level, indicating buyer interest.
📊 Pattern Overview:
Double Bottom / Potential Triple Bottom:
The chart illustrates a clear double bottom structure, potentially forming a triple bottom, suggesting accumulation and reversal from the lows.
Bullish Projection Path:
The yellow arrow outlines a projected bullish impulse wave, targeting higher resistance levels if support holds.
📈 Bullish Scenario:
If AVAX maintains support at around $17.1:
1. Price may first test $20.25 (initial resistance).
2. A breakout above $20.25 could open the way to:
$24.98 (strong weekly resistance)
$32.75 (previous distribution zone)
$55.42 (major target/resistance zone)
3. In an extended bullish cycle, price could revisit:
$98.87, $110, and even $128.62 long term (2026+)
A confirmed breakout above $25 with strong volume would further validate the bullish case.
📉 Bearish Scenario:
If the $15–17 support zone breaks down:
1. Price could drop further to:
$11.00 (minor support)
$8.61 (historical low and weekly support)
2. This would indicate strong bearish pressure, potentially leading AVAX into a longer-term accumulation phase.
🔍 Conclusion:
This is a critical decision zone for AVAX. The technical structure shows signs of accumulation and possible trend reversal. However, if support fails, a deeper retracement could occur. Traders should watch this area closely for breakout or breakdown confirmations.
#AVAX #AVAXUSDT #Avalanche #CryptoReversal #TechnicalAnalysis #Altcoins #WeeklyChart #CryptoSupportZone #CryptoBreakout

HolderStat┆AVAXUSD broke the resistanceBYBIT:AVAXUSDT on the 3h chart has confirmed a breakout from a falling wedge and is retesting $17.26. Price is now forming a higher low, with targets set at $20.50 and $23. This breakout structure supports continuation as momentum shifts back to buyers.

#AVAX/USDT#AVAX
The price is moving within a descending channel on the 1-hour frame and is expected to break and continue upward.
We have a trend to stabilize above the 100 moving average once again.
We have a downtrend on the RSI indicator that supports the upward move with a breakout.
We have a support area at the lower limit of the channel at 17.22, acting as strong support from which the price can rebound.
Entry price: 17.54
First target: 17.92
Second target: 18.22
Third target: 18.62

AVAX Analysis (1D)From the point where we placed the red arrow on the chart, it seems a correction has begun.
This correction appears to be a Diametric pattern, and wave E does not seem to be complete yet. It's expected that wave E will finish within the green zone.
The target could be the red box area.
A daily candle closing below the invalidation level would invalidate this analysis.
invalidation level: 10.90$
For risk management, please don't forget stop loss and capital management
When we reach the first target, save some profit and then change the stop to entry
Comment if you have any questions
Thank You

HolderStat┆AVAXUSD held the trend lineBINANCE:AVAXUSDT is rebounding from the 19 support after a falling-wedge break, flipping the pullback into bullish continuation. Holding the trend-line keeps Avalanche pressed north; clearing 22.8 unlocks 25 and fresh-highs narrative 📈

AVAXUSDT 1W AnalysisAVAX ~ 1W Analysis
#AVAX Buy from here if you still have confidence in this coin with a short term target of at least 20%+, long term target $55

Avalanche (AVAX) Price at Key Resistance – Potential Short Setup📉 AVAX/USDT – Possible Bearish Setup Developing 📉
Currently watching Avalanche (AVAX) paired with USDT 🔍, and price action is starting to show signs of bearish momentum creeping in.
We’ve seen a subtle shift to the downside, and I'm anticipating the potential for further weakness into the end of the week 📆🔻.
Here’s what I’m looking for:
🔹 A pullback into resistance — specifically the level highlighted in the video
🔹 A rejection and failure to break above that resistance zone
🔹 A bearish break of market structure following the rejection
If these conditions are met, I’ll be considering a short opportunity aligned with the developing trend 🔄📊.
🎯 As always, patience and precision are key — I’m not acting until price confirms the setup.
⚠️ Disclaimer: This is not financial advice. The content shared is for educational purposes only. Always conduct your own analysis and manage your risk appropriately.
