AVAXUSD ❕ reboundAVAX has fixed above 50EMA (1H TF)
50EMA broke above 200EMA (30m TF)
The asset may continue to rise after consolidating above the resistance level.
AVAXUSD

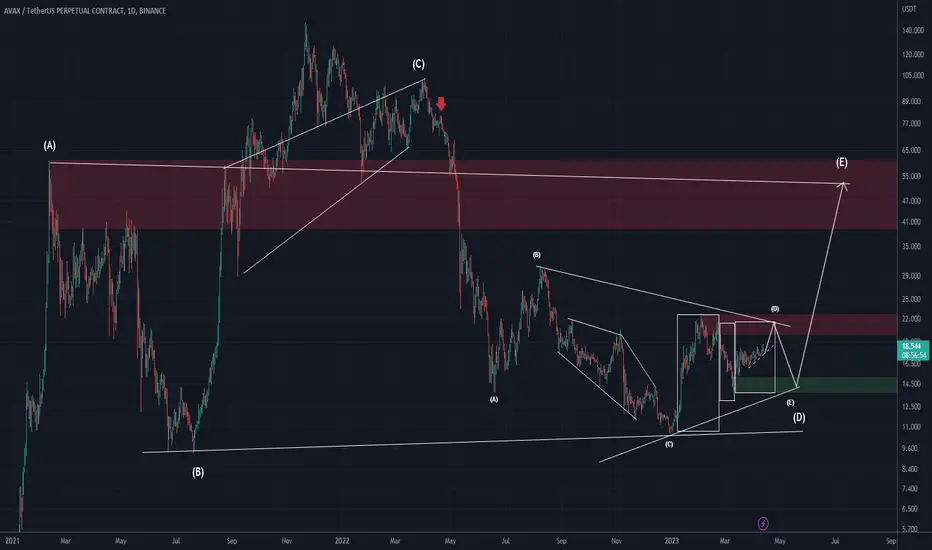
Avalanche AVAX price preparing for a new wave of growth ?It is very likely that the AVAXUSDT price is now completing a correctional wave (2)
Critical support below which the AVAX price should not fall is $13.90-16
If this is the case, then the Avalanche token holders will face a (3) growth wave ahead.
The targets for growth in this wave are currently "smeared" at 37-50$
If this asset is interesting to you, then be active in the comments, we will see them and make more ideas for AVAXUSD as the price grows
_____________________
Did you like our analysis? Leave a comment, like, and follow to get more

AVAXUSD ❕ fixed above the rangeAVAX has fixed above 200EMA on 1H TF.
TD Sequential formed an up reversal signal on the 1H TF.
The asset will continue to rebound.

AVAX UPDATE (1D)Hi, dear traders. how are you ? Today we have a viewpoint to BUY/SELL the AVAX symbol.
For risk management, please don't forget stop loss and capital management
When we reach the first target, save some profit and then change the stop to entry
Comment if you have any questions
Thank You
AVAXUSD long positionThe price currently remains in the middle of the range, which is not the best place to take a position. We are looking for a long position and we are expecting the price to retest the support which would be our entry.
Target and stop loss are shown on the chart.

AVAX flat personality!If you find this info inspiring/helpful, please consider a boost and follow! Any questions or comments, please leave a comment!
Its got some Elliott wave flat characteristic, but have to wait for the C wave to know for sure... Flats usually happen after or before extended waves so would be an nice pattern to trade, if it plays out.
Cheers!

Volatility Period: April 19-21Hello?
Traders, welcome.
If you "Follow", you can always get new information quickly.
Please also click "Boost".
Have a good day.
** Analysis of the BTC chart publishes new ideas once a week.
** However, we publish new ideas when volatility occurs or when we show signs of diverging from our expectations.
** Excluding the above situation, BTC analysis is listed as a daily update.
-------------------------------------
(AVAXBTC 1W Chart)
The question is whether it can rise above 0.0009 187.
If not, we need to see if it finds support around 0.0006 306 and breaks out of the downtrend line.
-----------------------------------------------
(AVAXUSDT chart)
During the volatility period around April 20 (April 19-21), it is necessary to check whether it can show a move out of the 19.16-23.96 zone.
If not, it should be sideways in the 19.16-23.96 zone to confirm the next volatility period around the 15th of May.
-------------------------------------------------- -------------------------------------------
** All descriptions are for reference only and do not guarantee profit or loss in investment.
** Even if you know other people's know-how, it takes a considerable period of time to make it your own.
** This is a chart created with my know-how.
---------------------------------

AVAX reversal in tha making 📈AVAX just flipped 50 weeks moving average
This is usually a very strong reversal signal
I am expecting much more upside in the next months 📈


AVAXUSD [D] Hopefully time to think daily!Even daily chart turn on GREEN, so hopefully it's time to aiming daily targets (29-33 band) instead of or charts.
Real decentralized platform and transparent management! Be your advisor!

AVAX USDT - LONG The possibility of the price going up right now or after touching the downward trend line is broken and the middle of the channel is resistance and the ceiling of the ascending channel is likely.
(it is clear in the picture)

AVAXUSDTHello friends, this analysis is a bearish analysis and upward movement is possible for the last upward attempt

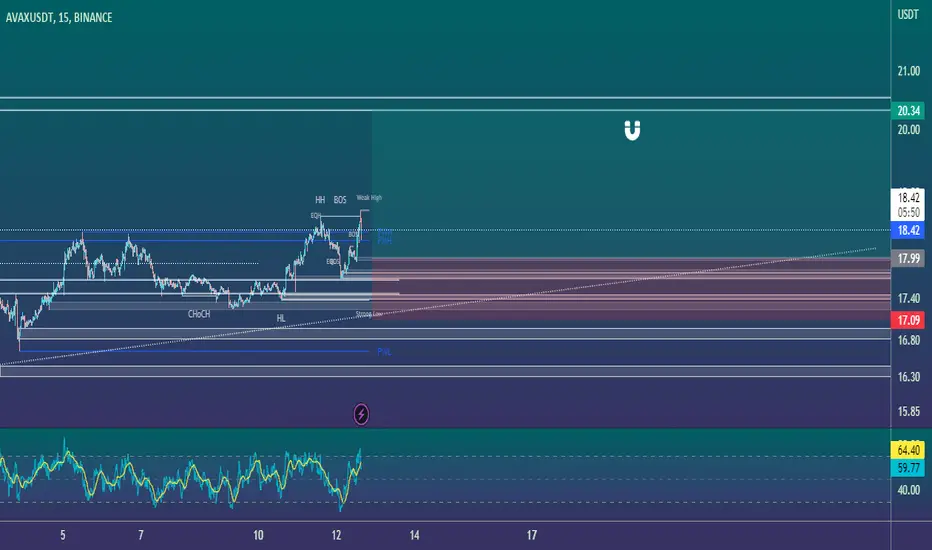
AVAX/USDT🔵🐇AVAX/USDT
🪄AVAX Scalp Position Based On Fresh Liquidity and Order Blocks and Structures
#avax #avalanche #eth #btc #bitcoin #ethereum #cryptocurrency #crypto #Trade #trading #Trader #Signal #forex #Scalp #altcoins #chart #RTM #ICT
AVAX - Road to 2024Typical bear market trend structure so far, keep printing LL - LH - LL - LH.
It looks like we are to print another LL.
I started DCAing BUT my bags are small as usual since it’s just the the first week of 50 week of accumulation for me.
IMO we are gonna start 2023 with a bear market rally and print the LH.
Winter is long, bags are small, bags will get heavier with time.

AVAXUSDT| ABC Wave Projection| Retesting Inv. H&S NecklineAVAX price breakout SMA50 with bullish pennant pattern, possible ABC pattern retesting mega inverted head & shoulder
TP 0.618 - 1.0 fibonacci retracement of wave B +25% upside
S1: SMA50 17.50 and S2: SMA 200 16.00

AVAXUSD ❕ above the liquidityTrading volumes have increased.
The RSI chart at 30m, 1H and 4H Timeframes indicates that the initiative has shifted to buyers.
I expect the rebound to continue.

✅TS ❕ AVAXUSD: above the support✅✅ AVAX bounced back from support.
Price is trying to return to an ascending structure.
We believe that the asset will resume its price rise. ✅
🚀 BUY scenario: long to 18.73. 🚀
----------------------------------------------------------------------------
Remember, there is no place for luck in trading - only strategy!
Thanks for the likes and comments

AVAXUSD Significant upside potentialAVAXUSD is trading inside a Channel Up having formed a Golden Cross (1d) 6 weeks ago.
The RSI suggests that one last pullback is possible before a new 1 month rally starts.
Trading Plan:
1. Buy on the next pullback to the MA200 (1d).
Targets:
1. 25.00 (top of the Channel Up).
Tips:
1. The ideal buy entry would be when the RSI (1d) hits the 30.00 oversold level again.
Please like, follow and comment!!

AVAX/USDT🐇AVAX/USDT
🪄AVAX looks like bullish with a bullish structure
- you can see scalp setup in the chart
- there are 2 fresh liquidity for Tp
#avax #avalanche #eth #btc #bitcoin #ethereum #cryptocurrency #crypto #Trade #trading #Trader #Signal #forex #Scalp #altcoins #chart #RTM #ICT

Avalanche FRVP on WeeklyI think FRVP gives a very good result in identifying support and resistance. In this direction, a FRVP that we will apply to the Avax chart in the weekly timeframe shows us that the 17.50 level is support and AVAX is sitting on this support. I think the return from this level in the weekly timeframe is very positive.

Avax going south?I'm trying and testing a new strategy, if you have any comments and ideas here don't take me too seriously, it's not a financial recommendation and I can definitely be 99% wrong =D

To get out of the bottom section... (19.73 important)Hello?
Traders, welcome.
If you "Follow", you can always get new information quickly.
Please also click "Boost".
Have a good day.
-------------------------------------
(AVAXBTC 1W Chart)
The question is whether it can break out of the downtrend line by rising above 0.0007352.
------------------------------------------
(AVAXUSDT chart)
------------------------------------------
(AVAXUSDT 1W Chart)
If the price is maintained above HA-High, it is highly likely to continue its mid- to long-term upward trend.
Therefore, the key is whether it can rise above 19.73 and be supported.
If not, you should check if it is supported around the HA-Low indicator.
(1D chart)
The key is whether it can be supported around 17.15 and rise above 19.72.
If it fails, you should check for support around 14.99.
The 17.15 point is the HA-High indicator point on the 1W chart, so if the price is maintained above this point, it is highly likely to continue the mid- to long-term upward trend.
However, it needs to rise above 19.73 to continue the upward trend.
-------------------------------------------------- -------------------------------------------
** All descriptions are for reference only and do not guarantee profit or loss in investment.
** Even if you know other people's know-how, it takes a considerable period of time to make it your own.
** This is a chart created with my know-how.
---------------------------------

AVAX Elliott Wave count 1H TFLooking for an 12 12 for avax.
Enter long above green line. Invalidation below red line
WXY correction for second wave 2.
Good luck!
Any questions? fell free to ask!!
