AVAX Weekly View - March 2023Hello Guys, Weekly Analysis is on the AVAXUSDT Symbol in a 1H Time frame, I Hope it Will be Useful for You, Don't Forget to Like, Follow, Comment
AVAXUSD

✅TS ❕ AVAXUSD: returned in the channel✅✅ AVAX/USD is in an ascending structure.
The chart is moving above the support area and has returned to the descending channel.
We expect the price to rise if it fixes in the channel.✅
🚀 BUY scenario: long to 18.73. 🚀
----------------------------------------------------------------------------
Remember, there is no place for luck in trading - only strategy!
Thanks for the likes and comments

AVAX 100 % gains comingWe expect that the price will get rejected at the strong resistance ($21,600 - $22).
You can short it (stop loss recommended) or be patient and wait for a price to drop into our buy zone ($10-$11). From there we expect a pump towards strong resistance again which would be over 100 % gain.
Mid-term the market remains bearish overall .

AVAXUSD ❕ hummerThe indicator relative to strength indicates weakness of the sellers.
On the 4H Timeframe the price has formed a "hammer" reversal pattern.
I expect a reversal from the support level.

✅TS ❕ AVAXUSD: before a reversal ✅✅ AVAX repeatedly can't break through the support area.
Volatility has clearly slowed down.
Price will bounce from the current range.✅
🚀 BUY scenario: long to 17.75. 🚀
----------------------------------------------------------------------------
Remember, there is no place for luck in trading - only strategy!
Thanks for the likes and comments


Avalanche/US DollarThese are levels that I'll be keeping an eye on when dealing with AVAXUSD, and I'll revise as price action progresses.
I adapt to the change in money flow.
Fundamentals:
Amazon Web Services (AWS) has partnered with Ava Labs in a bid to accelerate the adoption of blockchain technology by enterprises, institutions, and governments.
The move has sent the linked Avalanche AVAXUSD token soaring higher in recent days, outperforming even Bitcoin amid a major bull run in the biggest cryptocurrency.
.....
Seeing that price hit a significant low, potential profit margin resting above current price along with a bearish impulsive followed by a descending channel. I would wait for a break of the $20 & $30 price points and retracement for bullish precursors. We shall see...

Loco and Avalanche (AVAXUSDT)Loco's launch of LegendsByLoco on #Avalanche is a significant move for both the streaming platform and the #crypto coin. Avalanche is a well-established #cryptocurrency with a growing user base, and the #partnership with #Loco will likely drive even more adoption.
The launch of #LegendsByLoco on Avalanche is a significant development for Loco, as it allows users to participate in player-owned fantasy esports. This is a unique feature that sets Loco apart from other #streaming platforms, and it could help the company continue to dominate #India's streaming market.
Furthermore, the partnership with Avalanche gives Loco access to a reliable and secure blockchain platform that can handle high transaction volumes. Avalanche's consensus mechanism is designed to support high throughput and fast confirmation times, making it an ideal choice for Loco's fantasy esports platform.
Overall, Loco's partnership with Avalanche is a smart move that could help the company maintain its position as India's largest #video #game streaming #platform. With more than 50 million users and counting, Loco is well-positioned to take advantage of the growing interest in player-owned #fantasy #esports, and its partnership with Avalanche gives it a solid foundation on which to build.
Target zone: $37,90 - $41.00

✅TS ❕ AVAXUSD: trading in the channel✅✅ AVAX moves in a descending channel.
The chart was held under the upper border of the channel.
I expect that the asset will continue to decline. ✅
🚀 SELL scenario: short to 19.58. 🚀
----------------------------------------------------------------------------
Remember, there is no place for luck in trading - only strategy!
Thanks for the likes and comments

AVAXUSD First step into 25-26 band...AVAXUSD Let see if momentum enough for the 25-26 band till tomorrow despite negative market pressure.
Be smart; be your advisor!

AVAX/USDTIf this currency can cross the black range, it can climb up to $26.
But if Bitcoin falls and cannot maintain this range, I predict that this currency will correct itself from this range or even from the range of $22 to the range of $15.5 to $16.6 and then climb to the destination of $26. and start at $37
As you know, everything depends on Bitcoin and its every move is the decision maker of the overall market trend

AVAX Weekly View - February 2023Hello Guys, Weekly Analysis is on the AVAXUSDT Symbol in a 4H Time frame, I Hope it Will be Useful for You, Don't Forget to Like, Follow, Comment

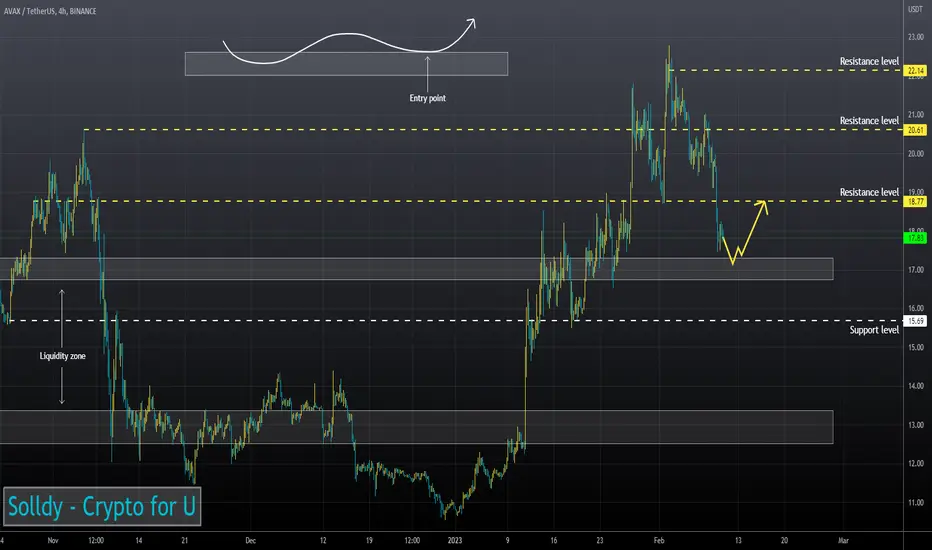
AVAX AVALANCHE Price Analysis 4 HOUR CHART Hey there! here are some key levels of support/resistance to keep an eye on!
Pretty simple here.
SPREAD THE LOVE guys ! and stay safe out there!
GHHEEET THAT CRYPTO YO ! $$$
BINANCE:AVAXUSDT

AVAX IS STILL BULLISHHi, dear traders. how are you ? Today we have a viewpoint to BUY/LONG the AVAX symbol.
For risk management, please don't forget stop loss and capital management
When we reach the first target, save some profit and then change the stop to entry
Comment if you have any questions
Thank You

Need to check if it is supported around 16.65-17.91Hello?
Traders, welcome.
If you "Follow", you can always get new information quickly.
Please also click "Boost".
Have a good day.
Thanks for your feedback on the dark mode, I made the chart in black as much as possible to match the colors used in the chart.
Please leave your thoughts on this in the comments.
-------------------------------------
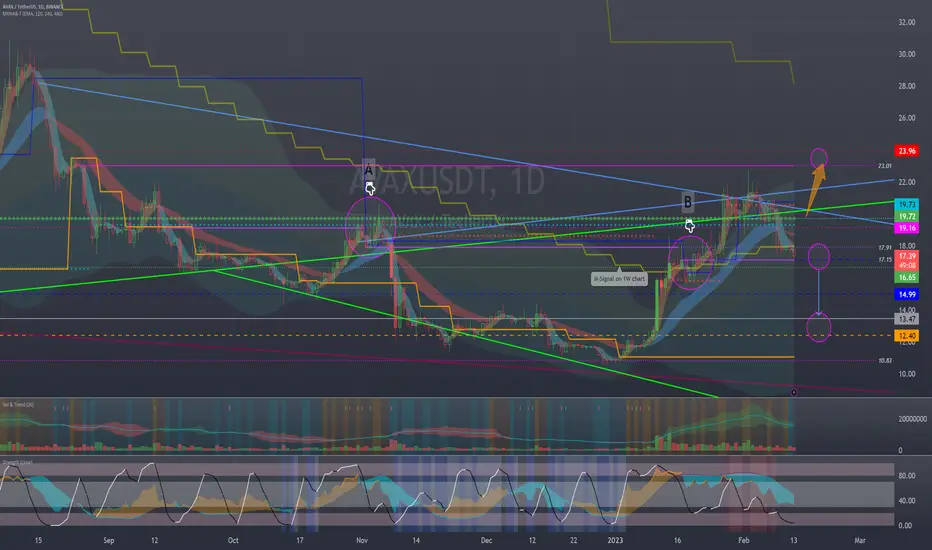
(AVAXBTC 1W Chart)
If it fails to rise above 0.0008 602, I would expect a sharp decline.
--------------------------------------
------------------------------------------
(AVAXUSDT 1W Chart)
The HA-High indicator is looking to be created on 17.15.
Therefore, the key is whether it can be supported around 17.15.
(1D chart)
Being supported and able to rise around 16.65-17.91 is important.
If not, I expect it to decline around 13.47.
-------------------------------------------------- -------------------------------------------
** All descriptions are for reference only and do not guarantee profit or loss in investment.
** If you share this chart, you can use the indicators normally.
** The MRHAB-T indicator includes indicators that indicate points of support and resistance.
** Check the formulas for the MS-Signal, HA-Low, and HA-High indicators at ().
(Short-term Stop Loss can be said to be a point where profit or loss can be preserved or additional entry can be made by split trading. This is a short-term investment perspective.)
---------------------------------
AVAX Weekly View - February 2023Hello Guys, Weekly Analysis is on the AVAXUSDT Symbol in a 4H Time frame, I Hope it Will be Useful for You, Don't Forget to Like, Follow, Comment

AVAXUSD ❕ above the liquidityAVAX is trading above liquidity.
Price is testing 200EMA as support (4H TF)
TD Sequential has formed a reversal signal up (4H TF)
I expect price to rise after fixing above the liquidity zone.
✅TS ❕ AVAXUSD: mirror area✅✅ AVAX has gained a foothold above the mirror support level.
The price continues to maintain an upward structure.
I think that the asset will continue to grow. ✅
🚀 BUY scenario: long to 21.72. 🚀
----------------------------------------------------------------------------
Remember, there is no place for luck in trading - only strategy!
Thanks for the likes and comments

Trading Idea 024: AvalancheMarket Conditions:
- bullish trend
- consolidation around the resistance
- bullish sentiment in the market
Key Level and Lines:
- $20.00 resistance
Trading Ideas:
- go short if the price stays below the resistance.
- go long if the price moves above the resistance and the crypto market is bullish.

AVAXUSDT Weekly View - February 2023Hello Guys, Weekly Analysis is on the AVAXUSDT Symbol in a 4H Time frame, I Hope it Will be Useful for You, Don't Forget to Like, Follow, Comment

Drawing supply and demand areas and possible scenarioDrawing supply and demand areas and possible scenario

AVAXUSDT: Local correctionA local correction in wave 4 is forming on AVAXUSDT, which makes it possible to plan an excellent entry into the trade at limit levels.
I will buy AVAX with a stop loss at $19, and a take profit at $30
