AVAXUSDT It is possible to climbIf the price stabilizes above 100, the ascent speed will probably increase, I considered the price of 75 as a loss limit, but this is related to your trade, good luck
*This is just an analysis, Trade with risk management
AVAXUSD

AVAX UPDATEAVAX has completed the retest and now we have the bounce off the resistance trend line. Very bullish and think our trade will go well.


AVAX Growing Relative to MarketAVAX growing relative to total crypto market & showing strength during the current bear market
See above
Bullish.

#AVAXUSD GO LONG if power of the total crypto market cap is highBINANCE:AVAXUSD
As i study and look on the chart and other resources i can tell possibility of upward movement is higher than other conditions
IF ONE IMPORTANT NOTICE YOU SEE AND THAT IS THE POWER OF THE TOTAL CRYPTO MARKET CAP AT THE MOMENT OF ACTION!
GL

AVAX - Take entry at these pointsBYBIT:AVAXUSDT
4H trend chart
-
AVAX just broke out the downtrend line, and that is the timing we can buy.
Also, it is forming a potential double bottom, which neckline is 90.855 on 4H.
So we can take entry again once the price overcome the neckline, and trading strategy as below.
-
Profit Targets:
a) 98.060~100.975----Fib(1.272~1.382)
b) 104.105----Fib(1.5)
c) 117.350----Fib(2)
Stop losses:
a) 76.4-----Red horizontal ray
-
If you like this analysis, smash the "like button" and leave a comment below to share your thoughts
or let me know what crypto you want to see!
Trading is a reflection of yourself. Learn more daily and be ready for every opportunity.
Have a nice trading!

AVAXUSDT Next target!AVAXUSDT (1D Chart) Technical analysis
AVAXUSDT (4h Chart) Currently trading at $79
Buy level: Above $80
Stop loss: Below $60
Target 1: $94
Target 2: $119
Target 3: $144
Target 4: $180
Max Leverage 2x / Spot Market
Always keep Stop loss
Follow Our Tradingview Account for More Technical Analysis Updates, | Like, Share and Comment Your thoughts

ETH to the doom, AVAX to the Boomboooooom
avax will kill bitcoin
you will see zack zack zack
btw listen to the Evil Morty Season 5 theme on YT, so amazing
Your Dr. Sins

$JOE Likely to Outperform $AVAXJOE/WAVAX looking extremely bullish.
5 wave structure completed, I think we'll see this one reach previous highs and eventually further.
This is looking like an easy way to 2-3x+ your AVAX bags. Can also stake $JOE while holding for further passive income gains.
We appear to have broken out of this triangle (falling wedge) as well. It looks like we have retested the trend line resistance and have also created a double bottom.

$JOE TraderJoe BullishDouble Bottom pattern appearing on $JOE
Bottom appears to be in, I expect this to outperform $AVAX as well
the passive income in stablecoins from staking is pretty nice too! Keep using that to accumulate more $JOE as we move up from these lows
$2 my end of April easily in my opinion.

AVAX is playing harmonicsalthough we are seeing a really bear market in crypto , some projects like Avalanche are still showing signs of strength. the odds of this scenario happening is really low but in crypto nothing is impossible. let me know what do you think about this scenario.
make sure to follow us on social media.

AVAXUSD close to breaking a flag and going up!Market is about to finish retracement to the uptrend, we are 50% fib zone and a strong support, we are looking for market to break the flag and rise up. MACD is bouncing between long and short it means we are losing momentum for short position completing consolidation and reversing to go back up, also we bounced off of a bottom Bollinger band.
Entry: 73
Target 1: 95.62
Target 2: 115.65
Invalidation: 62.55
Ratio to first target: 1:2
Ratio to a second target: 1:3.74
If you want a safer entry wait for market to break a structure up, you will have a bigger stop loss and less profit, but you will have no more confirmation to which side market is going.

AVAX/USDT : Crossing below the trendline ! BINANCE:AVAXUSDT
Hello everyone 😃
Before we start to discuss, I would be glad if you share your opinion on this post's comment section and hit the like button if you enjoyed it !
$AVAX is moving into a descending channel and now there's a break down attempt on the recent trendline.
In that case I would take a SHORT on the retest of broken level and hold it till $60.
For more details; I'll follow my plan like the chart below :
- Invalidation would be a reclaim above trendline.
Hope you enjoyed the content I created, You can support us with your likes and comments !
Attention: this isn't financial advice we are just trying to help people on their own vision.
Have a good day!
@Helical_Trades

Expecting downside for AVAX- General bearish momentum
- Inside golden pocket
- Touching 21 EMA
- Slight bearish divergence on RSI
Could possible move further towards resistance zone before retracing. If we see it break there and make a higher high, we could see bullish continuation.

AVAX's trend can't be determined yet!Hello every one
AVAX/USDT
🟡Chart is speaking it self!
-AVAX is in a symmetrical Triangle
-No break out yet
-depending on the break out the price shall reach 57 or 122$
- wait for Confirmation
_ _ _ _ _ _ _ _ _ _ _ _ _ _ _ _ _ _ _ _ _ _ _ _ _ _ _ _ _ _ _ _ _
Thank you for seeing idea .
Have a nice day and Good luck

avax 3-4 update ~good evening,
i'm a little bullish on avax.
i think we could potentially see a move up to about $100 in the weeks ahead.
it's been preparing for this move for quite some time, and it looks primed as of right now.
pretty large squeeze that it's in on the larger frames, and it can actually launch a lot higher than what i've got shown here.
$120 is my conservative upside target for avax.
AVAX could be headed to $210I see a potential bullish pattern forming in AVAX, an inverse head and shoulders. The measured move would put this around $210 or so and would be a huge massive pattern spanning several months, giving it a high chance of a large movement. This could always fail and invalidate (the last analysis on avax did), so be prepared especially given market volatility with ukraine/russia and interest rates with the fed.
Do your own research, this is not financial advice.

AVAX : An Overview
AVAX is still trading inside the bullish pennant in the daily timeframe. However, due to the market condition, I guess AVAX is more likely to break downwards and it it successfully breaks down, The support Zones will be 56 , 40 , 22 USD Ranges.

avax 3-3- updatemorning,
quick update to my previous post via:
we hit my target to the penny, and now it's looking like it wants to expand.
expansion target sits at $96 - this level is the absolute key.
if avax could push above it, a larger move up can easily take place.
few big levels after that: $102, $108, $119.

AVAXUSDT-LONGBased on technical factors there is a long position in :
📊 AVAXUSDT Avalanche
🔵 Long Now 87.40
🧯 Stop loss 80.60
🏹 Target 1 93.55
🏹 Target 2 98.60
🏹 Target 3 106.55
💸Capital : 1%
We hope it is profitable for you ❤️
Please support our activity with your likes👍 and comments📝

AVAXUSDT long for today's perp I was not posting for a few weeks I was (and I am) learning Price Action so now I'm back and I'll share more of my ideas with you guys. Hope you enjoy them <3
Avax is most likely to get to the target I've shown on the chart in the next few hours. Hope there is no new war news though

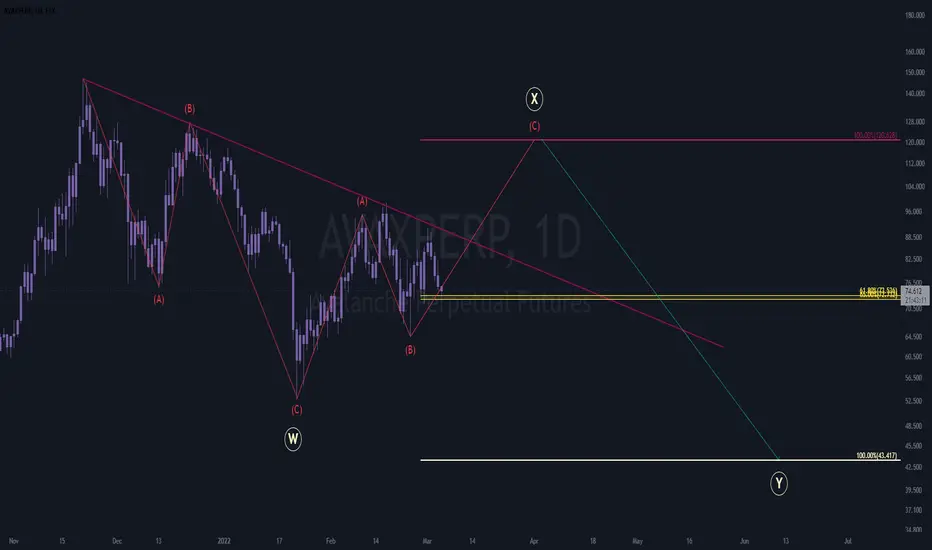
avax swing~looks like avax is gearing up for a little move,
potentially for wave C of an a-b-c.
it's possible this is also a 1-2 as well, in which case it would go a lot higher than what i have projected on my chart.
the burgundy 100% extension is the target for this trade,
a safe exit is at the green -0.236
(if it pushes to the yellow 1.618, expect a larger move to the upside).

AVAXUSDT AVALANCHE CHARTTrading Signal:
A Trading Signal is seen in the AVAXUSDT Avalanche .
Traders can open their Buy Trades NOW
⬆️Buy now 74.82$
⭕️SL: Close below 64.76
🔵TP @ 102.51
Move SL in
hat are these signals based on?
Classical Technical Analysis
Price Action Candlesticks Fibonacci
RSI , Moving Average ,SMOOTHED Ichimoku , Trend
