AVAX/USDTFor the Ava currency, I found the weekly time frame more convenient for analysis. The story is that the channel has ended and we are currently in a trading range and are moving towards the bottom of the trading range. Do you know how we should trade in trading ranges?
AVAXUSDT

When the range compresses, the breakout doesn’t ask — it takesThis isn’t a chop. It’s a setup. AVAX just printed the kind of consolidation Smart Money wants to see before delivery.
The setup:
After the impulsive drop, price carved out a micro-range with well-defined boundaries — compression structure nested inside inefficiency. The FVG above (marked in purple) hasn’t been mitigated, and price is now pressing upward into that void with rising volume.
But that’s not where the trade is. The real trade is in the retracement.
I’m watching for one of two entries:
Either we drive into the FVG first, then sweep back into the range floor to trap late longs
Or we sweep range low one more time, then rip straight into the imbalance
Either way, the invalidation is clean — below the swing low, under 18.66.
Execution plan:
Entry: 18.70–18.90 zone (post-sweep or reaction)
TP1: 19.80 fill (FVG midpoint)
TP2: 20.54 clean inefficiency clearance
Nothing about this is forced. Price is telling the story. I’m just listening.
Final thought:
“The range isn’t random. It’s the disguise Smart Money uses before they move size.”

Avalanche (AVAX) Price at Key Resistance – Potential Short Setup📉 AVAX/USDT – Possible Bearish Setup Developing 📉
Currently watching Avalanche (AVAX) paired with USDT 🔍, and price action is starting to show signs of bearish momentum creeping in.
We’ve seen a subtle shift to the downside, and I'm anticipating the potential for further weakness into the end of the week 📆🔻.
Here’s what I’m looking for:
🔹 A pullback into resistance — specifically the level highlighted in the video
🔹 A rejection and failure to break above that resistance zone
🔹 A bearish break of market structure following the rejection
If these conditions are met, I’ll be considering a short opportunity aligned with the developing trend 🔄📊.
🎯 As always, patience and precision are key — I’m not acting until price confirms the setup.
⚠️ Disclaimer: This is not financial advice. The content shared is for educational purposes only. Always conduct your own analysis and manage your risk appropriately.

Avalanche Recovers & Then Some... (Targets: $40-$46 & $81)I will keep it short, sweet and simple. Avalanche is recovering nicely with five consecutive days closing green; higher low; trading back above the 3-Feb. low (orange line) and marketwide bullish action.
The action is happening in the green zone, the bullish zone and a local higher low will lead to a higher high with a target of $40 first. This is the next target and it is an easy one. It will definitely move higher but consider $40-$46 the first strong barrier.
The main target sits at $81. I think the time horizon for this one is 1-3 months. Within 3 months, all these targets will be hit and then we will be blessed with additional growth.
Thanks a lot for your continued support.
If you enjoy the content, feel free to follow. I share new charts every single day.
It is my pleasure to write for you.
Namaste.

AVAX About to Nuke Longs Before Pumping to $30?Yello Paradisers — are you prepared for the next major #AVAX move, or will you once again fall into the trap smart money is setting right now? The chart is screaming probable bullish continuation, but not before one final trick to flush out weak hands. We warned you before — and now the game is unfolding exactly as expected.
💎#AVAXUSDT has clearly broken market structure by forming a higher high, confirming a potential trend shift. However, price failed to close above the 25.82–26.93 resistance zone, leaving the bullish breakout unconfirmed. This hesitation right at a critical level increases the probability of a fakeout or liquidity sweep before any continuation.
💎Right now, we are hovering just above the ascending trendline, and based on current structure, the most probable scenario is a sweep of that trendline liquidity, grabbing stops from impatient longs before the market forms a clean higher low and reverses aggressively to the upside.
💎The green zone around 22.00–23.00, which previously acted as resistance, has now flipped to support. As long as price holds above this level, the bullish probability remains dominant. However, if we see a temporary dip below the trendline toward the 19.08 region, where support lies, that would likely be a classic liquidity hunt — designed to trigger fear, force early exits, and then reverse powerfully into the next leg.
💎And while both scenarios favor upside, it is the path of maximum frustration — likely a wick into 19.00 — that has historically proven most probable before larger breakouts.
💎A sustained move above the 26.93 level, especially on a daily candle close, would significantly increase the probability of continuation toward the major resistance between 30.00 and 30.74. This zone remains the main upside target in the short to mid-term.
💎On the other hand, if price closes below 16.67, that would invalidate this bullish outlook and open the door to deeper downside. Until then, structure remains bullish, and the higher-probability outcome still favors upside after a potential short-term shakeout.
This is the point where the weak hands get shaken out and smart money reloads, Paradisers. If you're aiming for long-term success, wait for high-probability setups and protect your capital. Strive for consistency, not quick profits. Treat the market as a businessman, not as a gambler.
MyCryptoParadise
iFeel the success🌴

AVAX/USDTAVAX is currently in a consolidation phase.
The key area of interest is the liquidity zone around $20.14 combined with a daily FVG.
🎯 After a move into this zone, long setups can be considered — only if proper conditions are met.
Target to the upside: $21.49
📌 Waiting for confirmation before execution. No setup — no trade.

Price tapped the OB. I didn’t flinch.This was surgical. Price delivered into a 1H OB with precision — not luck, not noise — but with the full weight of algorithmic intent behind it.
My breakdown:
After price expanded into 21.50, it left behind a clear inefficiency trail — multiple 60min FVGs and a sharp void beneath the premium leg. I marked the OB that anchored the move — it hadn’t been retested. That’s not a coincidence. That’s where Smart Money builds.
What followed was a retracement into a triple confluence zone:
1H Order Block
Dual stacked 60min FVGs
Golden fib zone (0.618–0.786), perfectly aligned with 20.05–20.32
This isn’t about catching a falling knife. It’s about understanding why price would want to deliver here — and what it's likely to target next.
Expectation:
From the 20.05–20.32 reaction zone:
First objective: 20.99 (0.382 fib)
Next: 21.35 clean inefficiency fill
Final draw: 21.50 high / liquidity sweep
If we break below 20.00 with intent, I’ll wait lower. But until then, price is simply reloading.
Final words:
I don’t react emotionally. I prepare structurally. This is where most traders get trapped. I don’t.
“There’s no guesswork when you know where Smart Money enters.”

AVAXUSDT Forming Bullish reversalsAVAXUSDT is currently positioned at a major demand zone that has acted as strong support multiple times in the past. This area between $17 and $20 has historically triggered bullish reversals, and recent price action shows a potential bottoming pattern forming within this zone. The market has responded positively with a slight uptick in volume, indicating renewed buying interest from both retail and institutional investors. This setup could be the beginning of a sharp bullish rally, especially if the price holds above the support and breaks the near-term resistance levels.
Avalanche (AVAX) continues to attract investor attention due to its rapidly growing ecosystem and increasing adoption across DeFi, NFTs, and Web3 projects. As blockchain infrastructure becomes more critical, AVAX stands out with its high throughput and low-cost transactions, making it a competitive choice for developers and users. The network has seen consistent upgrades and ecosystem expansion, which boosts long-term investor confidence. From a technical standpoint, the current structure resembles a classic accumulation range with a breakout potential pointing toward a 90% to 100% gain in the coming weeks.
If AVAX can reclaim and hold above the $22–$23 level, it would likely trigger a strong impulsive move toward the $42–$45 target range. The risk-reward ratio remains highly favorable for swing traders and position traders aiming to capitalize on this potential reversal. The expected upside is clearly illustrated on the chart, and with broader market sentiment slowly shifting bullish again, AVAX could be one of the top performers in this cycle.
With confluence from strong technical support, solid fundamentals, and increasing investor interest, AVAXUSDT is setting up for what could be a major bullish leg. Traders should keep a close eye on breakout confirmation and volume expansion for entry signals.
✅ Show your support by hitting the like button and
✅ Leaving a comment below! (What is You opinion about this Coin)
Your feedback and engagement keep me inspired to share more insightful market analysis with you!

Trendlines Hold Firm: AVAX Faces Continued Selling PressureAVAX has been in a steady downtrend since mid-May, marked by two descending trendlines. Each rally into the upper blue trendline (around $21.20) has been met with selling pressure, resulting in lower highs. The red horizontal lines at $23.03 and $25.78 show prior support turned resistance, with the $23.03 level failing to hold when AVAX pulled back in late May.
More recently, price attempted to reclaim the steeper of those blue trendlines but was rejected, confirming bearish control. On the downside, the green support line at $18.63 has acted as a pivot zone twice (late April and mid-May), and the $16.00 area served as a strong floor in early May. With momentum still favoring sellers, a short entry at the next rejection near $21.10–$21.20 offers a favorable risk/reward.
Below are the precise levels:
Trade Setup (Short AVAX/USDT)
Entry: Short around $21.10–$21.20 after a clear wick/rejection against the upper blue trendline.
Stop-Loss: $22.00, just above the failed breakout zone and beneath the $23.03 resistance.
Take Profit 1 (TP1): $18.63 (recent horizontal support).
Take Profit 2 (TP2): $16.00 (major demand zone from early May).

AVAX Bulls Walking into a Trap? Yello Paradisers, are we on the edge of a clean breakout or is AVAX setting up the perfect trap before flushing the late bulls?
💎#AVAXUSDT has recently broken above a critical resistance zone and is now attempting a retest. This move appears strong on the surface, but it sits at a dangerous pivot—one that could determine the short-term direction in the days ahead. The structure is unfolding within a clean ascending channel, with both resistance and support levels well respected. These rising boundaries give the breakout credibility, but they also highlight how vulnerable the setup is if key support levels fail.
💎Right now, the level that previously acted as resistance is being tested as support. This is the moment of truth. If the price continues to hold above this level with strength and volume, we’re likely in for a continuation toward the next resistance level around $22.40. But the real test for bulls will come at the $23.00 region, where heavy profit-taking and increased selling pressure are highly likely. That’s where the larger players will look to trap over-leveraged longs and reposition.
💎But this bullish outlook comes with a clear condition and it’s non-negotiable. If #AVAX fails to hold $21.00 and begins closing candles back inside the previous range, the move instantly loses its legitimacy. In that case, our focus turns to the strong demand zone between $20.20 and $20.40. A reaction from this area could still save the structure, offering a potential reload for a bounce. But if this level gives way, the entire bullish setup is invalidated and what was once a breakout turns into a confirmed bull trap.
Trade smart, Paradisers. This setup will reward only the disciplined.
MyCryptoParadise
iFeel the success🌴

AVAX/USDT Technical OutlookAVAX/USDT has broken market structure to the upside by forming a confirmed higher high, indicating a potential bullish trend reversal. However, despite this structural shift, the price failed to secure a daily close above the key resistance level at $26.02, leaving the breakout unconfirmed for now.
Currently, the pair is trading marginally above an ascending trendline. Given the present market structure, the most probable scenario involves a liquidity sweep below the trendline — targeting stop-losses from early long positions — before establishing a clean higher low and initiating a strong bullish reversal.
The $22.40 level, which previously acted as resistance, is now serving as key support. As long as price remains above this level, the bullish bias remains intact. However, a temporary deviation below the trendline and a move toward the $19.47 support area would likely represent a classic liquidity grab — designed to shake out weak hands before a sharp move higher.
A confirmed daily close above $26.49 would significantly increase the probability of continued upside momentum, with the next major resistance zone lying between $30.60 and $32.87. This zone remains the primary upside target in the short- to mid-term.

AVAX/USDT#AVAX Spot Strategy 🚀
AVAX is currently at a solid buy zone for spot entries.
The coin is in the top 15 by market cap, which adds fundamental strength.
💡 Recommended DCA approach:
Split your planned allocation into 3 entries — market volatility and manipulations remain high, especially lately.
• Entry 1 — at current price
• Entry 2 — around $15
• Entry 3 — if price drops to the $7–4 zone
This gives an average entry of ~$15, creating strong upside potential.
🎯 Targets:
• Target 1 = $35 (+50% from current levels)
• Target 2 = $45 (+90%)
• Target 3 = $55 (+135%)
📌 Key resistance zone: $30–35
Once reached, we’ll monitor price action + seasonal market behavior.
If momentum supports it, additional entries could be considered in that area.

$AVAX Update – Breakout Retest Play!!CRYPTOCAP:AVAX is respecting the ascending trendline beautifully after a clean retest of the breakout zone.
The price is holding above the trendline, and the 200 EMA is in the 4H timeframe.
Multiple confluences align around the $22.5–$23 zone – a critical support area now flipped from resistance.
Targets are set at:
• 26.81
• 29.47
• 33.40
As long as we hold this support, the upside potential remains strong.

TradeCityPro | AVAX: Watching Key Resistance in RWA Uptrend👋 Welcome to TradeCity Pro!
In this analysis, I’ll be reviewing the AVAX coin — one of the popular RWA projects in crypto with a high market cap.
🔍 This coin currently has a market cap of $9.94 billion and ranks 14th on CoinMarketCap.
⏳ 4-Hour Timeframe
As shown on the 4-hour chart, there’s a clear ascending trendline that has been tested several times. There was also a fake breakout below the trendline, and now price is reacting to it once again.
⚡️ A resistance level has formed at 23.90, which the price has reacted to. Given the recent bounce off the trendline, the probability of breaking 23.90 has increased.
✔️ A break above 23.90 offers a potential long entry, though this isn’t the main long trigger. The target for this move would be 25.78. The main long position should be considered after a breakout above 25.78.
💥 The 25.78 zone is a key resistance level that marked the top of previous bullish legs, so breaking it could lead to a strong bullish trend.
🔽 On the flip side, if the price prints a lower high below 25.78 and moves back toward the trendline, the probability of breaking the trendline increases.
✨ If the trendline breaks, the confirmation trigger would be 22.10. A break below 22.10 opens a short setup, with the next support level located at 19.23.
📊 Currently, market volume is favoring the buyers. With renewed buying volume off the trendline, if this momentum continues, the bullish scenario becomes more likely.
📝 Final Thoughts
This analysis reflects our opinions and is not financial advice.
Share your thoughts in the comments, and don’t forget to share this analysis with your friends! ❤️

AVAXUSDT 📊 BINANCE:AVAXUSDT Chart Analysis
AVAX price, after breaking the key resistance at 22.20, is showing a strong upward move 📈 toward the next resistance at the end of the second leg at 30.00 USD. The 22.00 level could act as a pullback and provide strong support 🔄. If it consolidates above 30.00, the uptrend may continue to 37.00 🚀.
Support and Resistance Levels:
Supports:
• 22.20 🛡️
• 20.00 🛡️
• 17.50 🛡️
Resistances :
• 30.00 🚧
• 37.00 🚧

AVAX Weekly Outlook – A Potential 558% Move Ahead?CRYPTOCAP:AVAX is coiling inside a massive multi-year symmetrical triangle on the weekly chart. This is a textbook structure where volatility contracts before an explosive move, and the setup looks nearly complete!
🔹 Entry Zone: Highlighted accumulation zone around CMP- $17
🔹 Breakout Target: If AVAX breaks out, we could see a move toward $147 (a whopping +550%)
🔹 Resistance to Watch: $45-$50 range – historical supply zone
🔹 Support: The Ascending trendline from 2021 continues to act as a strong base
Fundamentals Behind the Chart:
Avalanche (AVAX) is one of the fastest smart contract platforms in terms of time-to-finality. It supports Subnets (custom blockchains), which are gaining traction for scalable enterprise and gaming solutions. With growing DeFi and NFT adoption on Avalanche, fundamentals are aligning with this technical setup.
If this breakout holds, AVAX might become one of the best large-cap performers in the next cycle.

AVAXUSDT 1D AnalysisAVAX ~ 1D Analysis
#AVAX Buy gradually from here if you still have confidence in this coin with a short term target of at least 10%+ from here.
The key is whether it can find support at 24.59 and rise
Hello, traders.
If you "Follow", you can always get new information quickly.
Have a nice day today.
-------------------------------------
(AVAXUSDT 1M chart)
The key is whether the price can be maintained by rising above the M-Signal indicator on the 1M chart.
Accordingly, we need to see whether the price can be maintained by rising above 27.47.
-
(1W chart)
The important support and resistance range is the 38.93-51.54 range.
Therefore, even if the price is maintained by rising above the M-Signal indicator on the 1M chart, the uptrend can begin only if it rises above the 38.93-51.54 range.
If it falls, we need to see whether it can be supported near the volume profile range of 6.54-13.47.
-
(1D chart)
When it breaks upward around 28.67, it is expected that a breakout trade will be possible.
However, since an important support and resistance section is formed over the 38.93-51.54 section, a response is needed depending on whether there is support in this section.
Therefore, the key is whether it can be supported and rise around 24.59.
If not, it is necessary to check whether it is supported around 17.54-19.79.
-
The basic trading strategy is to buy when supported by the HA-Low indicator and sell when it meets the HA-High indicator.
However, if it is supported and rises near the HA-High indicator, it is likely to show a stepwise upward trend.
On the other hand, if it is resisted and falls near the HA-Low indicator, it is likely to show a stepwise downward trend.
Therefore, since it is currently located near the HA-High indicator, it can be seen that trading is possible depending on whether there is support.
However, since the probability of falling is higher than the probability of rising in the HA-High indicator, you should be careful about the investment ratio.
Otherwise, you may end up buying at the high point.
-
Thank you for reading to the end.
I hope you have a successful trade.
--------------------------------------------------
- Here is an explanation of the big picture.
(3-year bull market, 1-year bear market pattern)
(3-year bull market, 1-year bear market pattern)
I will explain the details again when the bear market starts.
------------------------------------------------------

AVAX Is My The Most Confident Investment!Hello, Skyrexians!
It's time to update my previous BINANCE:AVAXUSDT analysis because when I told that correction is over as usual I have a lot of haters in comments. They told me how you can bet for one altcoin growth and other's dump - easy!
This crypto has the clearest structure for me. Wave 1 was very impulsive and after that we have seen almost flat correction. Wave B finished slightly below wave's 1 top, wave C slightly below wave's A bottom. Divergence on Awesome oscillator and momentum growth is showing that correction is over and the next target is 1.61 Fibonacci above $100 in wave 3.
Best regards,
Ivan Skyrexio
___________________________________________________________
Please, boost this article and subscribe our page if you like analysis!

Avax Buy IdeaTo a Classical Chart trader this has flash a buy signal.
I add candlestick to my trading plan, so, today candle closing will finish the whole story for me.

AVAX Potential UpsidesAVAX/USDT is currently trading within a broader uptrend and is in a corrective phase. The price is approaching the 24.60 level, a key support and resistance area that aligns with the prevailing trend structure. This zone may offer insight into potential market reaction and the strength of the ongoing trend.

Avalanche With Higher Targets —1,700% Profits PotentialWe've been looking at Avalanche many times but each time only with short-term targets, that is because we were considering a leveraged trade setup. When using leverage, we tend to ignore the higher targets because profits tend to climb pretty high pretty fast even with the short-term ones. But this doesn't mean that these targets won't hit or that you should ignore them. In these types of leveraged trade setup, once the great entry is achieve and the market goes bullish, it is easy to hold long-term. Once the holding is in place, you can wait for whatever target you prefer. Leveraged trading is for experienced traders and you have to develop your own plan, I only share the numbers, the timing and the charts.
Looking at AVAXUSDT, notice the blue line and inverted triangle. The current week recovered the early March drop that led to the correction bottom. The correction produced the lowest prices since November 2023.
Now that the low is in and fully confirmed, we know the market will enter a bullish phase. This means long-term growth, thus we need to map some long-term targets.
The main target that I am mapping for you is $162, this is an easy target. By easy I mean that Avalanche has potential to grow beyond it. Total profits from current price is equal to 560%.
The final target on this chart is 949% at $257. I believe this isn't likely to be the end for this pair and even higher is possible. In fact, if you move the chart upwards a little bit you will find additional targets.
While Avalanche can grow really strong, ~900% is a lot, incredible and perfect. We are happy with such big wins/moves if it happens but we are ready for more.
It will go higher.
Thanks a lot for your continued support.
Namaste.

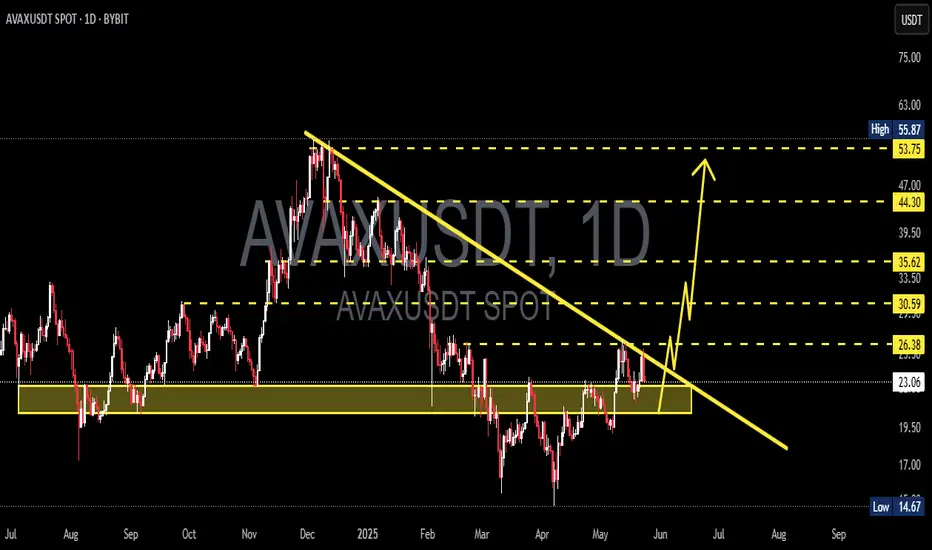
$AVAX/USDT Trade Setup - Daily TF$AVAX/USDT Trade Setup – Daily TF
#AVAXUSDT has broken a multi-month downtrend and is retesting a key demand zone, offering a clean long opportunity.
Entry: $19.70–$20.00
Stop Loss: $15.00
Targets: $27 / $35 / $55
Invalidation: Close below $15... DYRO, NFA
Watch for a bullish confirmation before entry.
Swing setup with strong potential if the demand holds.
