AVAX → Avalanche Reversal Imminent!? The Tipping Point is Near.Avalanche (AVAX) is burning red hot on the charts and flirting with the idea of a reversal. Do we have the justification to short here? Or will the trend continue upward?
How do we trade this? 🤔
AVAX has three pushes up in this trend, three sell bars near the $44.00 level, and an RSI level of 82.00 and below the Moving Average. These are all signs that a trend change is coming in the near future and at the very least, entering a long position here is not justified.
It is reasonable however to capture some of the downward price action with the correct indicators. We need break below the bull channel support around the Daily 30EMA with a strong bear bar closing on or near its low. Followed by a retest of the channel support as resistance to confirm that the bull trend is over. At this time, its reasonable to scalp a short at 1:1 Risk/Reward around the $31.00 level, stop loss at $37.00, and take profit at $25.00.
It is also reasonable to go for a 1:2 Risk/Reward down to $19.00 after moving your stop loss up to your entry price and taking half profits at 1:1 Risk/Reward.
Until then it's wise to remain on the sidelines and wait for the correct signals to enter the market.
💡 Trade Ideas 💡
Short Entry: $31.00
🟥 Stop Loss: $37.00
✅ Take Profit: $19.00
⚖️ Risk/Reward Ratio: 1:2
🔑 Key Takeaways 🔑
1. Bull Channel, Bias to Long!
2. Three Pushes up in Trend with Sell signal, Signal to Change Trend.
3. Gap to Second Push Support Line.
4. RSI at 82.00 and below Moving Average, Strong Bias to Short
5. Wait for Short Confirmation bar before entering a position.
💰 Trading Tip 💰
Probability that the price will go the direction of the trend is low at the beginning (swing trade) and end (late scalp) of a trend. Proportion your position size, risk (stop loss placement), and reward (take profit placement) to the probability of profit at your entry price.
⚠️ Risk Warning! ⚠️
Past performance is not necessarily indicative of future results. You are solely responsible for your trades. Trade at your own risk!
Like 👍 and comment if you found this analysis useful!
AVAXUSDT

⚡️AVAXUSDT CMC TRADING ⚡️ LQ GRAB ENTRY MODELIn AVAXUSDT, there has been a successful capture of Liquidity (LQ) above the point of interest, surpassing the prior high established on the left side. Subsequently, there is a retracement inside indicated by ChoCh, forming a Former Value Gap (FVG) or Imbalance on the corresponding Order Block (OB). Our anticipation involves a retracement, tagging in, and subsequently filling the FVG for an opportune short entry.

AVAX: Resistance BreakoutTrade setup : Bullish break above $35 signaled continuation of uptrend. However, price is now very overbought (RSI ~ 90) and we’re likely to see it pause here on some profit taking.
Trend : Uptrend across all time horizons (Short- Medium- and Long-Term).
Momentum is Bullish but extremely overbought. ( MACD Line is above MACD Signal Line). RSI is bullish (> 55) but extremely overbought (> 80) which could imply that price could briefly pause or pull back if it reaches Resistance.
Support and Resistance : Nearest Support Zone is $35 (previous resistance), then $25. The nearest Resistance Zone is $50.

Where is the destination of AVAX✅⁉️
🔴AVAX is poised to explode after a 130% surge in the last 3 months. Are you ready🔍👀
🔴Note: All white lines are PRZs, which are generated based on x.y.z.🎗️
🎗️AVAX to reach all-time high and surprise us?🌪️

AVAX Leading DiagonalHello again
The King Of All TA Guys Is Here Again!
* Before you BS and say how come "wave 4 will go below 1" go read about diagonal wave first.
so as you see the avax finished 5 waves of the leading diagonal which represent the wave 1
so everything is mentioned on the chart
THANKS

AVAX Looks ready to pumpAvax trend is still strong, the bulls are behind the door. I expect a good pump as soon as the price can broke up the resistance i drawed. Target 47/48 area

AVAX (Follower Request)Somebody just asked my thoughts about Avaxusdt.
I Just don't trade this one at all so this is not any trade idea.
I am just sharing my thoughts and idea about what could happen and what could be the ideal scenario in this one.
I think this one can claim 50 Area and Deviate back to range.
Boosts and follows helps me to motivate for new Ideas.
Thanks.
Note: This is not a trade idea.
Note: Not a Financial Advice.

satsusdtSupport and press the rocket to cheer me up
Observe the ten percent loss limit
Stay away from Bitcoins
Feel free to buy and sell and post your comments

AVAX → Avalanche About to Reverse!? Or Continue to the Upside?Avalanche has been roaring through a nice curving bull channel until the top of the third push at $42.75! A nice sell signal formed on yesterdays daily candle, now we need to see how today closes to make our next move.
How do we trade this? 🤔
Avalanche had its third push up in the bull channel, a typical number of legs before the trend changes into a trading range or reverses. Given Bitcoins recent sell-off at a key resistance level, I believe it will drag AVAX down with it. AVAX has a sell signal on yesterdays candle and if today closes with a strong bear candle, we're likely looking at putting in some more lows. The RSI is also over 75.00 and below the moving average, all supporting at least a short-term bearish sentiment.
We need follow-through! Yesterdays signal is not enough justification to enter a short. It's best to wait for the price to fall to the 30EMA and see what happens there. If we get a bounce then another rejection to the downside, we'll have a head and shoulders reversal pattern on our hands at which time, a short will be justified.
💡 Trade Idea 💡
Short Entry: $26.00
🟥 Stop Loss: $32.00
✅ Take Profit: $14.00
⚖️ Risk/Reward Ratio: 1:2
🔑 Key Takeaways 🔑
1. Bull Channel, Bias to Long!
2. Three Pushes up in Trend with Sell signal, Signal to Change Trend.
3. Gap to Second Push Support Line.
4. RSI at 75.00 and below Moving Average, Bias to Short
5. Wait for Short Confirmation at potential Right Shoulder.
⚠️ Risk Warning! ⚠️
Past performance is not necessarily indicative of future results. You are solely responsible for your trades. Trade at your own risk!
Like 👍 and comment if you found this analysis useful!

Avalanche (AVAX) posts triple-digit monthly gainAvalanche’s market cap has grown by 340% since October, and AVAX price has followed.
The latest rally has seen Avalanche’s total market value grow more from $3.25 billion when the recovery started in mid-October to the current value of $14.35 billion. This represents an increase of over $341% in just two months.
......................................................................................................................
We are not registered or licensed in any jurisdiction whatsoever to provide investing advice or anything of an advisory or consultancy nature.
and are therefore are unqualified to give investment recommendations.
Always do your own research and consult with a licensed investment professional before investing.
This communication is never to be used as the basis of making investment decisions, and it is for entertainment purposes only.

AVAX LOOKS BEARISHBy hitting the red lines, which are daily supply, the price has turned downwards and a bear CH has been formed and the trend line has been broken. It is expected that after a little fluctuation and the efforts of buyers, the price will move towards the specified target
For risk management, please don't forget stop loss and capital management
Comment if you have any questions
Thank You

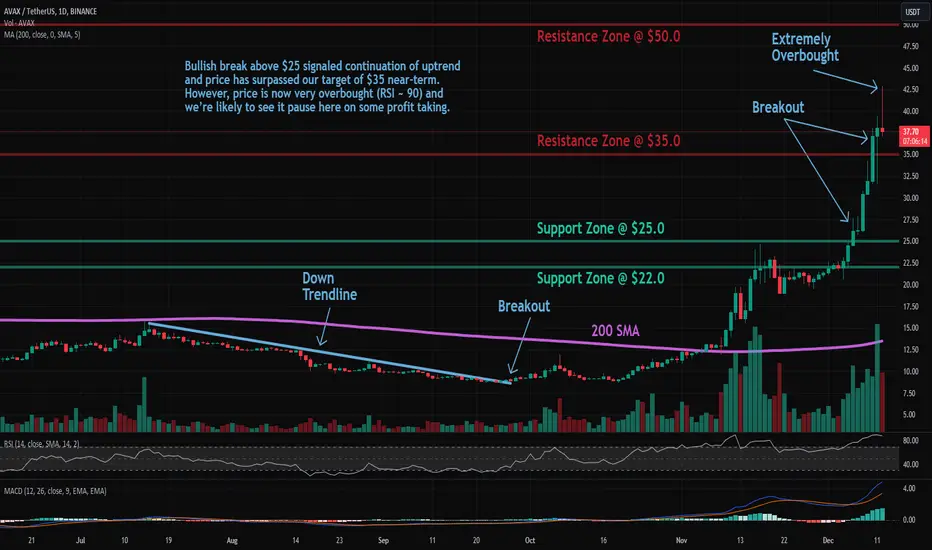
AVAX: Resistance BreakoutAvalanche (AVAX) technical analysis:
Trade setup : Bullish break above $25 signaled continuation of uptrend and price has surpassed our target of $35 near-term. However, price is now very overbought (RSI ~ 90) and we’re likely to see it pause here on some profit taking.
Trend : Uptrend across all time horizons (Short- Medium- and Long-Term).
Momentum is Bullish but extremely overbought. ( MACD Line is above MACD Signal Line). RSI is bullish (> 55) but extremely overbought (> 80) which could imply that price could briefly pause or pull back if it reaches Resistance.
Support and Resistance : Nearest Support Zone is $25 (previous resistance), then $20. The nearest Resistance Zone is $35, which it broke, then $50.
AVAX/USDT Bracing for a Bullish Journey?👀 🚀Avax Today Analysis💎 Yello paradisers, spotlight on #AVAXUSDT as it unfolds a compelling narrative in the crypto trading landscape. Nestled within a demand zone and having recently executed a Market Structure Shift (MSS), it is showing strong signs of a potential bullish uptrend.
💎 Delving into #Avalanche's market trajectory reveals a pattern of strategic moves. AVAX has a history of meticulously following a descending trendline, only to break above it, ushering in upward movements.
💎 Presently, CRYPTOCAP:AVAX is poised to challenge a notable Bearish Order Block (OB), with its recent MSS trajectory adding credence to bullish prospects. Moreover, a deep dive into its performance shows it sustaining robust momentum above the EMA100, hinting that if this upward trend continues, targets at $31.13 and $41.34 supply levels may well be within reach.
💎 However, in the fluid crypto market, #AVAX traders should be prepared for varying outcomes. If the expected bullish breakout falters, a rebound strategy from the support level of $19.59 becomes essential.
💎 A drop below this support level would necessitate a strategy shift, indicating a need to reassess the bullish outlook and adapt trading strategies accordingly. 🌴💰

Avax Bullish pennantTrying out this new chart patterns indicator, making our life much easier.
Seems like it caught a pretty accurate bullish pennant on the 12h chart and also showing the target.
Technical indicators also support bullish momentum.
Lets go AVAX!

AVAXUSDT.P perfomance in 2023 till DecemberLooking back at 2023. Although the cryptocurrency market is in a difficult process. But there has been some pretty good growth recently. This is the backtest result from the beginning of the year until now of AVAX perp (AVAXUSDT). It can be automated.

avaxSupport and press the rocket to cheer me up
Observe the ten percent loss limit
Stay away from Bitcoins
Feel free to buy and sell and post your comments

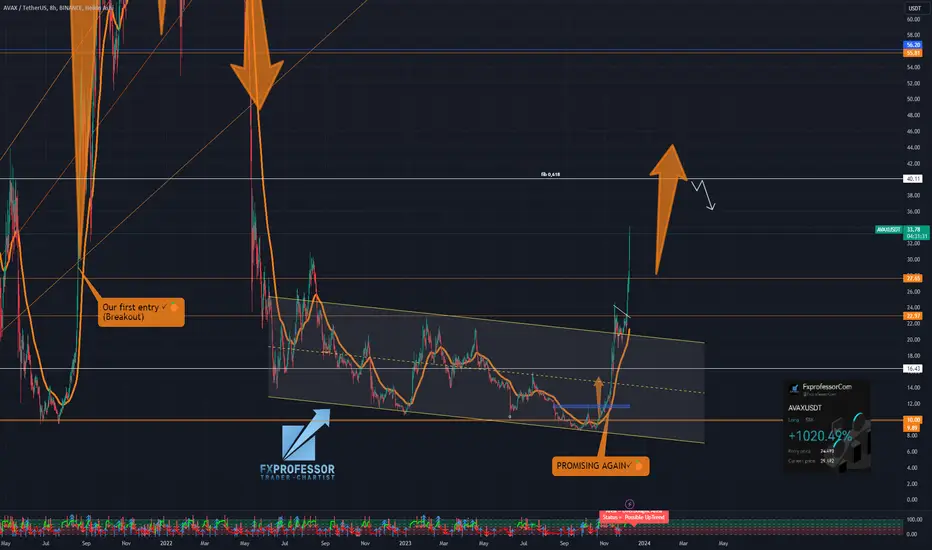
AVAX Avalanche: Scaling the Crypto TerrainHey Crypto Warriors! 👋 The FXProfessor here, exploring the exhilarating peaks of AVAX Avalanche. Let's dissect its current momentum and plot our course through this dynamic crypto landscape!
AVAX Avalanche's Market Dynamics:
📈 Experiencing Robust Growth: AVAX is not just climbing – it's soaring.
🎯 On the Radar: Aiming for pivotal targets as AVAX continues its ascent.
Key Support and Resistance Levels:
🛑 Solid Support: Watch out for crucial support levels that bolster confidence.
🧗♂️ Climbing to New Peaks: Breaking certain thresholds could signal a rally to new heights.
Strategic Outlook:
📊 Navigating through AVAX’s volatile landscape requires a keen eye and a steady hand.
⚡ Every step counts – whether it's a cautious hold or a strategic trade.
Long-Term Potential:
🌌 Exploring the potential for significant gains as AVAX challenges its limits.
🔭 Keeping a close watch on its trajectory towards ambitious long-term goals.
Trading Approach:
🌟 Patience and thorough analysis are crucial in harnessing AVAX's potential.
📝 Stay adaptive to its dynamic market movements.
FXProfessor's Insights:
🌐 AVAX isn't just another crypto; it's a bold player reshaping the digital asset space.
🔄 Regular updates to come as we track its thrilling journey.
Let's strategize wisely, stay ahead of the curve, and conquer the crypto mountains together!
One Love,
The FXProfessor 💙
ps. be careful not to FOMO.. We follow the market and chart levels
Celebrate the Avalanche's Unstoppable Rise!
It brings me immense pleasure to inform you that Avalanche continues to dominate the crypto space, with its price soaring higher than ever before, effortlessly surpassing the moving average. This remarkable achievement is a testament to the incredible potential and resilience of the Avalanche ecosystem.
Are you ready to ride the wave of success with Avalanche? If so, then consider this idea your invitation to join the Long Avalanche Movement today
Here's why I believe Avalanche is a golden opportunity worth exploring:
1. Unparalleled Performance: Avalanche has consistently outperformed market expectations, demonstrating its strength and stability amidst turbulent times. Its upward trajectory has been extraordinary, instilling confidence and excitement among traders worldwide.
2. Innovative Technology: Powered by Avalanche's groundbreaking consensus protocol, the platform offers lightning-fast transactions and low fees, making it an attractive choice for both institutional and retail investors. The ecosystem's commitment to innovation and scalability sets it apart from the competition.
3. Growing Adoption: Avalanche's popularity is on the rise, with an increasing number of projects and developers choosing to build on its robust infrastructure. The expanding ecosystem clearly shows the platform's widespread acceptance and potential for long-term growth.
So, how can you get involved and seize this opportunity? Here's your call to action:
1. Research and Educate Yourself: Dive into the world of Avalanche and familiarize yourself with its unique features, use cases, and potential. Understanding the technology and its implications will empower you to make informed investment decisions.
2. Stay Updated: Keep a close eye on Avalanche's latest news, project updates, and market trends. Follow reputable sources, join the community forums, and engage in discussions to gain valuable insights and stay ahead of the curve.
3. Take Action: When you feel confident and ready, consider adding Avalanche to your investment portfolio. Whether you're a seasoned trader or a beginner, there are various avenues available to participate in the Avalanche ecosystem, including spot trading, staking, and yield farming.
So, what are you waiting for? Join the Long Avalanche Movement.

Brief Analysis——AVAXIn November, the Inscription and BRC-20 themes became popular in the market. After that, many chains followed Ordi and launched inscriptions on their chains. For example, AVAL, NEAT, POLS, etc. This action brought attention, caused the gas fee on the chain to rise rapidly, and the token price also rose. Benefiting from this, AVAX's performance in December was ahead of most other tokens in the market. So one month after the last report on AVAX was released, let’s check what's going on with AVAX now?
Avalanche is an classic blockchain, but we can see that after many new and interesting narratives emerged this year, Avalanche has not fallen behind. AvaGPT, Stars Arena, Aval and Benqi were hot topics in each cycle. This also reflects the willingness of developers to build dapps on the Avalanche ecosystem.
Before the analysis, we saw that many tokens, including AVAX, had a correction a few hours ago, but we looked at the news from analyst James Seyffart or about the BTC ETF, and there was no bad news about the BTC ETF. On a macro level nothing has changed. We know your concerns.
On the daily level, the ME indicator shows that AVAX is in a bullish trend and the purple wavy area is widening. From the WTA indicator, we can see that the last round of rise was supported by many blue bars representing whales. And the bullish trend ends with the appearance of a destructive candle (shown by the red arrow). After that, although the rise ended, the bears did not strengthen. AVAX remained fluctuating for about 15 days and began a new round of rise. In this round of rise, AVAX has risen faster, but not many whales are involved. This shows that most whales believe that at this point, above 26 is not a good entry point.
In summary, AVAX is a token worth paying attention to as it can create additional Alpha. However, the base of this round of rise is not solid. If destructive candles appear in the subsequent time, then this round of rise may end.
Disclaimer: Nothing in the script constitutes investment advice. The script objectively expounded the market situation and should not be construed as an offer to sell or an invitation to buy any cryptocurrencies.
Any decisions made based on the information contained in the script are your sole responsibility. Any investments made or to be made shall be with your independent analyses based on your financial situation and objectives.

AVAX/USDT In the crucial zone. Break out or rejected ??💎 AVAX has undeniably captured significant attention in the market. Currently positioned in a crucial area, it is encountering a robust supply zone. Today's closing candle, characterized by a strong green bullish engulfing pattern and a flawless bounce from the support area, hints at the possibility of an AVAX breakout in this region. Such a breakout would signal a bullish trend for AVAX, probability leading to a substantial upward movement toward our target area.
💎 However, if AVAX fails to overcome the formidable resistance of the strong supply area, facing a significant rejection, there's a likelihood of a retracement. AVAX may retreat, retesting the support area and potentially reaching the demand zone. It's noteworthy that AVAX is yet to undergo a retesting phase after breaking out of the descending channel. The demand area also coincides with the resistance trendline of the descending channel. If the support fails to hold, AVAX might experience a decline, testing the demand.
💎 The bad scenario is confirmed if, during the retesting phase at the demand area, AVAX fails to maintain its position and undergoes a breakdown. In such a case, AVAX would shift back to a bearish movement, potentially retracing to the key support area.

EGLD/USDT it required break the resistance to continue upward!!💎 EGLD has undoubtedly captured significant market attention. It executed a flawless breakout from the supply area, marked by substantial volume and a robust green bullish candle. However, encountering a formidable rejection in the resistance area prompted EGLD to initiate a retesting phase at the demand area spanning $38.20 to $36, which previously served as the supply area.
💎 Presently, EGLD is in a consolidation phase within the range of the resistance and demand areas. To sustain its upward momentum, EGLD needs to break out of the resistance. A successful breakout holds the probability for EGLD to smoothly ascend and reach our target area. However, failure to attempt a breakout in the near future may lead EGLD back to testing the demand area.
💎 In the event that EGLD revisits the supply area of $38.20 to $36 and undergoes a breakdown of the demand area, there's a likelihood of EGLD descending to the subsequent lower demand zone at $33 to $30. EGLD retains a chance for an upward reversal, contingent on a bounce from the demand area at $33, reclaiming the support level at $38.20.
💎 The unfavorable scenario unfolds if, during the retesting at the demand, EGLD struggles to sustain its position and breaches the demand area. In such a scenario, EGLD would revert to a bearish movement, potentially retracing to the robust support area.

AVAX IS BULLISHBefore this, we thought that we were inside a diametric because all the rules for a diametric structure were followed. But the financial market is not always a single scenario
With recent pumps our next scenario is a triangle. The range of flip and ob is the right place to buy avax to the higher targets of Makki
We specified the first TP. When the first TP is broken, AVAX can go up to the ATH

AVAX: Overbought at ResistanceTrade setup : Bullish break above $25 signaled continuation of uptrend and price has surpassed our target of $30 near-term. However, price is now very overbought (RSI ~ 75) just as it reached that $35 resistance. Hence, near-term, we’re likely to see it pause here on some profit taking. Previously, price broke above 200-day moving average, which confirmed a bullish trend reversal to an Uptrend.
Trend : Uptrend across all time horizons (Short- Medium- and Long-Term).
Momentum is Bullish but extremely overbought. ( MACD Line is above MACD Signal Line). RSI is bullish (> 55) but extremely overbought (> 80) which could imply that price could briefly pause or pull back if it reaches Resistance.
Support and Resistance : Nearest Support Zone is $25.0 (previous resistance), then $22.0. The nearest Resistance Zone is $30.0, which it broke, then $35.0.
