✴️ AVAX 5X But Why Not More? (Beyond 500% Potential)I shared a new trade signal for AVAXUSDT and went with 5X, why not more?
Back in December and January, we do 10X easy because we can clearly see a bottom pattern and the initial breakout taking place.
In March we can clearly see correction ending but things can change.
Since the pair is already moving, since we are no longer near support/multi-year low, we reduce the risk and that's why 5X and no more.
People can always increase or reduce the leverage as they see fit.
You can always use more collateral and so on...
Leveraged trading is for experts only, there is high risk involved.
High risk with a very high potential for reward.
We are live on this pair and Matic 5X as well.
This is not financial advice.
See you at the TOP!
Namaste.
AVAXUSDT

AVAX USDT | Perfect risk / reward ratio!#AVAX/USDT
🟢Entry price: from 17.47 to 16.6
🟢 or you can trade the breakout of 17.5 for more safe entry
🟢 Also, waiting for a confirmation of breakout by closing the current weekly candle above 17.44 will be perfect!
🎯Targets:
|> 20
|> 23
|> 28
🔴Stop-loss: Weekly candle closes under 16.6
➡️Recommended risk: 0.25%
➡️Recommended Position Size for entry point #1: 2.5%
➡️Recommended Position Size for entry point #2: 5%

AVAX reversal in tha making 📈AVAX just flipped 50 weeks moving average
This is usually a very strong reversal signal
I am expecting much more upside in the next months 📈

AVAXUSDTHello Crypto Lovers,
Mars Signals team wishes you high profits.
This is a one-day-time frame analysis for AVAXUSDT
R1 on the top of this chart is our resistance area that includes the disability of the price to rise. S1 and S2 used to be resistance areas. And we have S3 that is a long-term support area with its support of price at different points since the past. Thus, we see the price moved over S1 when it was supported at S2 area and now we see its fluctuation above S1. We believe when the price is supported at S2 after its decline to this point and then by providing us some confirmation candles for the purpose of a rise, an increase will happen to it to reach R1 or by more fixation over there, more rise is expected then. But by the time the price loses the support and is rejected at any points especially at R1, or even by falling below S1, clearly it faces more decline down to lower amounts. Bear in mind that you should check everything before putting your trade orders and then wait for a proper time to have your next action. If you are looking for wise trades and less risky ones, our suggestion will be following our regular updates all the time.
Warning: This is just a suggestion and we do not guarantee profits. We advise you to analyze the chart before opening any positions.
Wish you luck


AVAX- Breakout to TOP-10 ?? 🔝🔟Well, chart says the breakout scenario could be in play and AVAX is in the top-15 at the moment.
Top-10 will be difficult but potential for 12-13 is in play.
In any case we have a nice set-up for a trade as 19,12 is support.
23$ - 27$ and 40$ are targets for taking profit.
News:
Avalanche Surges to 6-Month High in Daily Active Addresses
The spike coincided with a bevy of financial institutions joining Avalanche’s Evergreen subnet “Spruce.”
Avalanche’s daily active addresses hit nearly 80,000 on April 12. Its daily active user base grew 85% in the past 90 days, making it one of fastest-growing protocols, ahead of BNB Chain, Tron, Ethereum, Aptos and Bitcoin. Only four protocols grew faster, per Artemis: StarkNet, Arbitrum, Stacks and Canto.
The high-water mark coincided with Avalanche’s April 12 partnership with a bevy of financial institutions that will contribute to its network infrastructure, signaling traditional finance companies’ increased interest in the Avalanche ecosystem.
One Love,
The FXPROFESSOR

AVAXUSDTHello friends, this analysis is a falling analysis and in a very low time frame, upward movement is possible for the last upward movement.

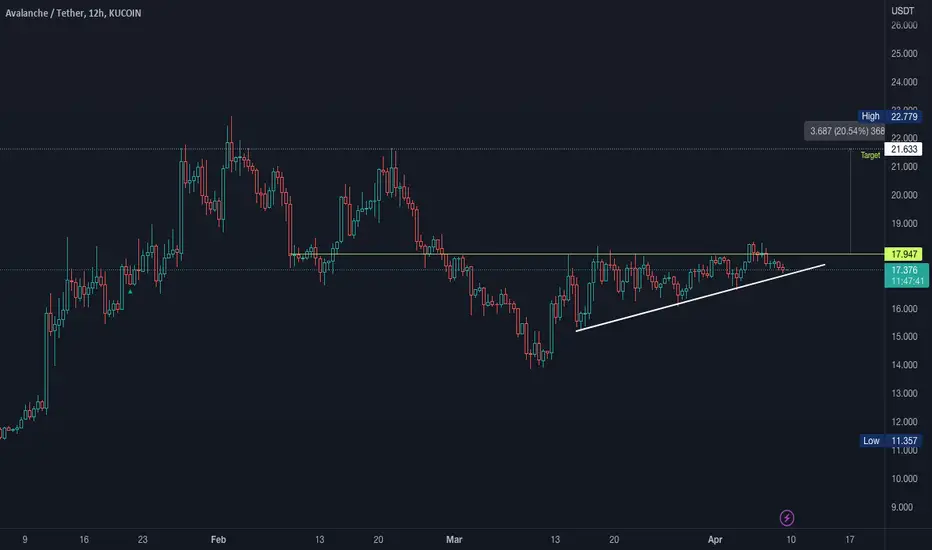
AVAX three taps clearPrice since June 2022 is in a drawn range and will see some consolidation in certain areas. Based on the price movement, now BINANCE:AVAXUSD has touched three taps on the marked section and could re-test the previous resistance.
This is an overview of what will be my trading plan to take partial profits, namely:
TP1: $19.61
TP2: $22.26
TP3: $25.63
and change each TP to SL+
note: this is not a solicitation of investment, all risks are borne by each only expressing opinions and personal opinions

AVAX USDT - LONG The possibility of the price going up right now or after touching the downward trend line is broken and the middle of the channel is resistance and the ceiling of the ascending channel is likely.
(it is clear in the picture)


AVAXUSDTHello friends, this analysis is a bearish analysis and upward movement is possible for the last upward attempt

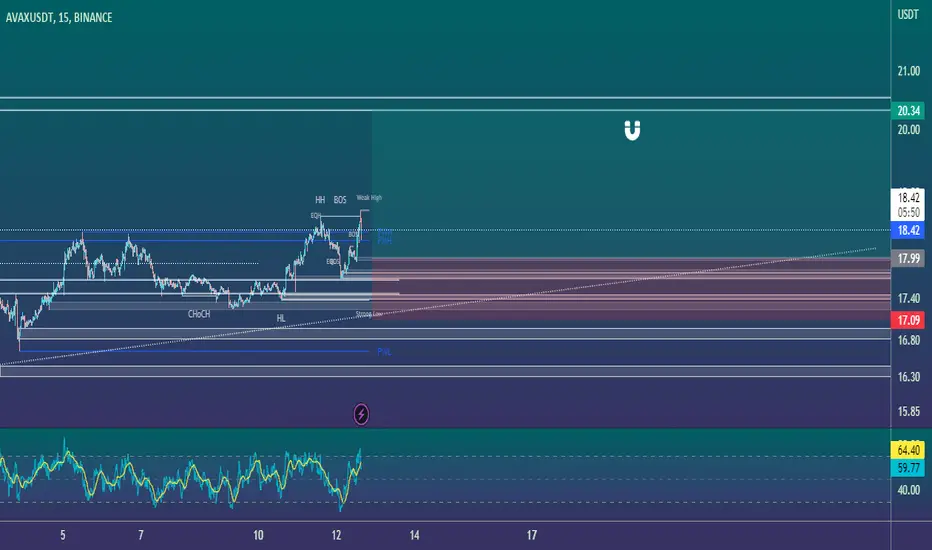
AVAX/USDT🔵🐇AVAX/USDT
🪄AVAX Scalp Position Based On Fresh Liquidity and Order Blocks and Structures
#avax #avalanche #eth #btc #bitcoin #ethereum #cryptocurrency #crypto #Trade #trading #Trader #Signal #forex #Scalp #altcoins #chart #RTM #ICT
AVAX BUILD UP BREAKOUT!KUCOIN:AVAXUSDT
AVAX price action is squeezing for an imminent move following Bitcoin.
Read my post about Bitcoin earlier today.
Possible upside 20% and if Bitcoin rejects look for shorts to structure.
Higher Lows back into neckline, looking like a possible build up to break out.
Always having Plan A and Plan B scenarios so we can react once the markets provide an opportunity to execute our edge.
If you liked this idea or if you have your own opinion about it, write in the comments.
The information and publications are not meant to be, and do not constitute, financial, investment, trading, or other types of advice or recommendations.
AVAX - Road to 2024Typical bear market trend structure so far, keep printing LL - LH - LL - LH.
It looks like we are to print another LL.
I started DCAing BUT my bags are small as usual since it’s just the the first week of 50 week of accumulation for me.
IMO we are gonna start 2023 with a bear market rally and print the LH.
Winter is long, bags are small, bags will get heavier with time.

AVAXUSDT| ABC Wave Projection| Retesting Inv. H&S NecklineAVAX price breakout SMA50 with bullish pennant pattern, possible ABC pattern retesting mega inverted head & shoulder
TP 0.618 - 1.0 fibonacci retracement of wave B +25% upside
S1: SMA50 17.50 and S2: SMA 200 16.00

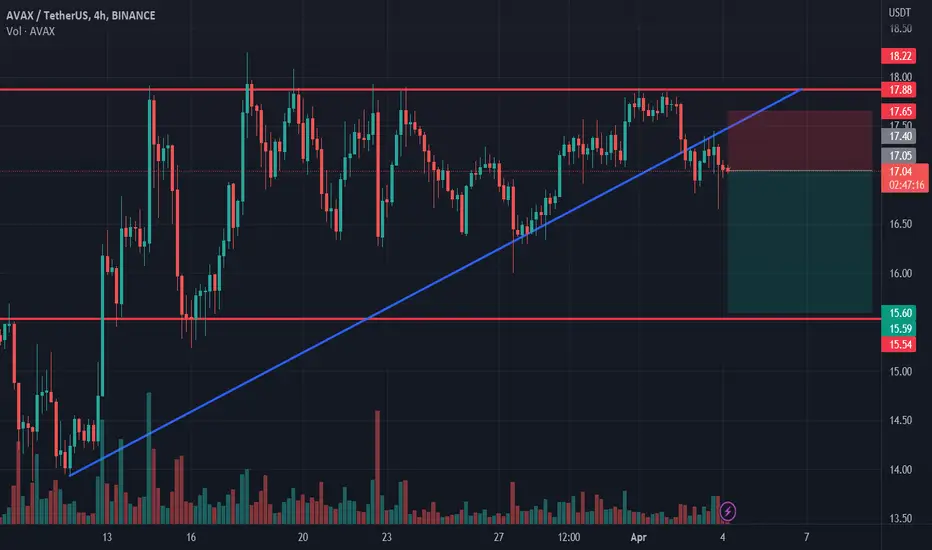
AVAX shortAVAX bounced off the resistance level. Asset broke trough off the ascending trendline. Bearish movement to support level at 15.55 is possible.

AVAXUSDT - in the hope of rapid growthHello everyone. A week ago, there was an idea for AVAXUSDT, where we approached the level and fought off the trend. So, they strayed from the trend line, but it didn't work out to take the level. And so they went to a new circle. Now there is no place left where the price could go, so the level should already be broken. The goal of the movement remains the same - 20. In general, the positive trend remains for coins, so we are waiting for growth. Stop over the line at 17.18.


AVAX/USDT🐇AVAX/USDT
🪄AVAX looks like bullish with a bullish structure
- you can see scalp setup in the chart
- there are 2 fresh liquidity for Tp
#avax #avalanche #eth #btc #bitcoin #ethereum #cryptocurrency #crypto #Trade #trading #Trader #Signal #forex #Scalp #altcoins #chart #RTM #ICT

AVAX shortAVAX bounced off the resistance level. Asset broke trough off the ascending trendline. Bearish movement to support level at 15.6 is possible.
AVAX breakline playoutLets see how AVAX reacts at this level, $ETH price holding well at this level, more volume and we break that line to 17.79$

AVAXUSDT waiting for the exit of the levelHello everyone. According to AVAXUSDT, a beautiful picture is obtained. We have had an uptrend for three weeks now, we are not interrupting past lows and now we have come close to the level of 18. The trend line supports us from below, so we put a stop for it at 16.95. We are waiting for further exit with a target of 20 USDT.

Avalanche FRVP on WeeklyI think FRVP gives a very good result in identifying support and resistance. In this direction, a FRVP that we will apply to the Avax chart in the weekly timeframe shows us that the 17.50 level is support and AVAX is sitting on this support. I think the return from this level in the weekly timeframe is very positive.
