AVAX Long To 20the chart is showing bullish sign and the descending channel is baroken and pull back is completed.
its third wave of the first Elliott wave and third always act stormy.
enter in 3 steps and enjoy.
AVAXUSDT

Fast long on AVAXFast long on AVAXUSDT. The idea that very volatility move and we go back to try test high before will try to test new low. Will see...

Buying pressureAVAX has recorded a 25% gain in the last 24 hours. Buying pressure and increased demand have led to the failure of two important static resistances. The first resistance at $13 has now turned into good support. But the power of the buyer is so high that the possibility of a pullback to this support area has decreased. But another support is in the $13.8-$14.20 range, where a return to this level could trigger higher targets for AVAX if there is a positive reaction. The target we can consider for Avax is in the range of 21-22 dollars.

AVAXUSDT Elliott Waves AnalysisHello friends.
Please support my work by clicking the LIKE button👍(If you liked). Also i will appreciate for ur activity. Thank you!
Everything on the chart. (midterm expectations)
Entry: market and lower (11 - 9$ zone)
Target: 13 - 15 - 17.5 - 20
after first target reached move ur stop to breakeven
Stop: (depending of ur risk). ALWAYS follow ur RM .
risk is justified
Good luck everyone!
Follow me on TRADINGView, if you don't want to miss my next analysis or signals.
It's not financial advice.
Dont Forget, always make your own research before to trade my ideas!
Open to any questions and suggestions.

AVAX (The Ethereum Competitor)AVAX / USDT
AVAX known as "The Ethereum Competitor" made a strong recovery from the HTF support
Seems like it bottomed out ,you can see it just made a breakout like it made in past (august 2021) from this support it made X16 in just 4 months in 2021 !
could history repeat itself again ?
Best of wishes

In order to transition to a mid- to long-term uptrend...Hello?
Traders, welcome.
If you "Follow", you can always get new information quickly.
Please also click "Boost".
Have a nice day.
-------------------------------------
(AVAXBTC 1W Chart)
AVAX, one of the coins that are expanding the coin ecosystem, is rising to a section where it is likely to emit the power of rising.
If it rises above 0.0009 187, it is judged that there is a possibility of exploding the power of the rise.
------------------------------------------
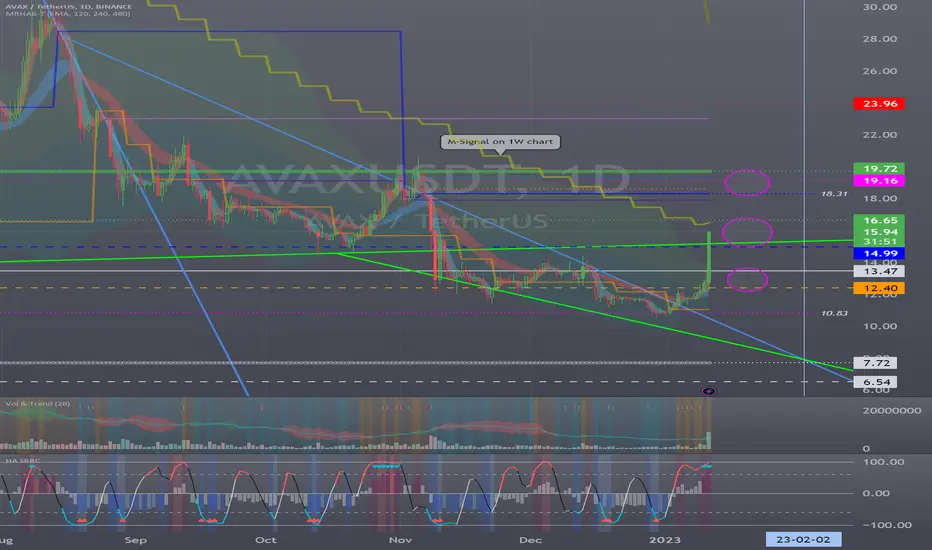
(AVAXUSDT 1W Chart)
It shows a movement out of the volume profile section of 6.54-13.47.
If the price rises above the MS-Signal and maintains the price, there is a high possibility that it will turn into an upward trend from a mid- to long-term perspective.
(1D chart)
The key is whether it can rise above 19.72 with support in the 14.99-16.65 section.
If not, you should check if the price holds within the 12.40-13.47 zone or higher.
Since the M-Signal on the 1W chart is formed around 16.65, it is important whether it can rise above 16.65.
-------------------------------------------------- -------------------------------------------
** All descriptions are for reference only and do not guarantee profit or loss in investment.
** If you share this chart, you can use the indicators normally.
** The MRHAB-T indicator includes indicators that indicate points of support and resistance.
** HA SRRC indicators are displayed as StochRSI (line), RSI (columns), and CCI (bgcolor).
** The CCI indicator is displayed in the overbought section (CCI > +100) and oversold section (CCI < -100).
(Short-term Stop Loss can be said to be a point where profit or loss can be preserved or additional entry can be made by split trading. This is a short-term investment perspective.)
---------------------------------
AVAX BUILD UP BREAKOUTKUCOIN:AVAXUSDT
AVAX has broken out of bullish smaller cup and handle and possibly printing a buildup (visible clearer on LTF). On break possible Long for upto 26% upside.
SOL - posted yesterday broke to +30% and consolidating for possible leg higher
If you liked this idea or if you have your own opinion about it, write in the comments.
The information and publications are not meant to be, and do not constitute, financial, investment, trading, or other types of advice or recommendations.

Double TopHere's another trade for today. Saw this double top with bearish divergence and matching wicks hitting the resistance zone. So now i'm riding AVAX going down.

Early BlessingHere's an early winning trade with AVAXUSDT. As always. we go with the trend... The trend is your best friend.


The Journey ContinuesHere's another trade for AVAXUSDT. We're still riding this baby going down... Strong momentum to the downside so we entered after the pull back...

Avalanche Trading IdeaAvalanche Trading Idea. - lets see how it goes. marked the levels for plans and triggers

Momentum is the key...I'm in with AVAXUSDT for SHORT. Trade looks good with good momentum to the downside... Clearly we're in a downtrend with consistent lower highs and lower lows...

Going up with AVAXUSDTHere's a trade with AVAXUSDT. Clearly, it shows higher highs and higher lows so we're going up. Waiting for it to hit my TP target.

$AVAX #AVAX | LTF LONGThis zone might be worked as a support level.
The bottom of the red box, liquidity zone and around 11.36 will be the points I will observe as resistance.
With the loss of 10.68 (1H) , the first bounce of the price will be around 10.18.
I wish everyone a good year.

AVAX Breakout PotentialIndicators used:
True Momentum Oscillator
Fibonacci Bollinger Band Cluster
Consensus Tables
The daily AVAXUSDT chart seems primed for a breakout, with lower timeframe charts beginning bullish movement. The TMO is in the oversold lower range with the momentum heating up towards the zero line. Price is hovering around the bottom-most band of the Fib. Bollinger Band cluster, past the 1st, 2nd, and 3rd deviations. Price action is testing upper bounds of a larger trendline, potentially as part of a falling wedge. Wedges of the sort have a tendency to break into inverse head and shoulder patterns, which could lead to a price recovery into the $13.50-14.40 range, provided BTC holds up. Otherwise, a test of the lower trend line is likely.

AVAXUSDT TRADING PLAN!!AVAXUSDT bounced from a key level and created a range.
the pair has broken the range.
AVAXUSDT can be bout after a pullback to highlighted zone.
sell will not be so much high because we are still in a global downtrend.
buy: 10.80 to 11.00
sell: 11.20 to 11.40

The point to be supported is...Happy new year!
Traders, welcome.
If you "Follow", you can always get new information quickly.
Please also click "Boost".
Have a good day.
-------------------------------------
(AVAXBTC 1W Chart)
In order to dissipate the rising force, it must rise above 0.008 602 ~ 0.0009 187.
--------------------------------------
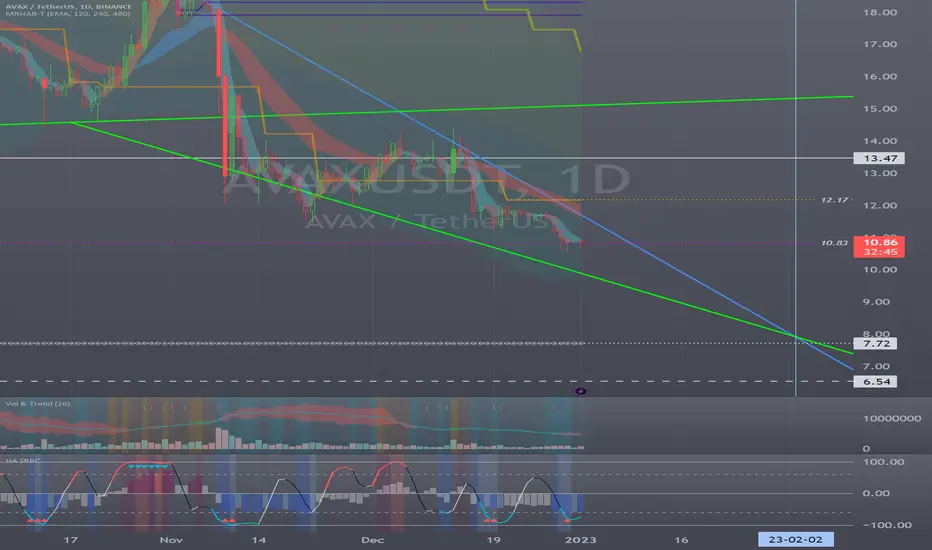
(AVAXUSDT 1M Chart)
The key question is whether the price can sustain its rise above 13.47.
If not, it is better to wait until HA-Low is created in the long term.
(1W chart)
If it continues to decline along the downtrend channel, there is a possibility of a decline to around 6.54, so we need to think about countermeasures.
(1D chart)
The question is whether it can break out of the downtrend channel by moving sideways around 10.83.
If not, a decline to around 7.72 is likely.
-------------------------------------------------- -------------------------------------------
** All descriptions are for reference only and do not guarantee profit or loss in investment.
** If you share this chart, you can use the indicators normally.
** The MRHAB-T indicator includes indicators that indicate points of support and resistance.
** HA SRRC indicators are displayed as StochRSI (line), RSI (columns), and CCI (bgcolor).
** The CCI indicator is displayed in the overbought section (CCI > +100) and oversold section (CCI < -100).
(Short-term Stop Loss can be said to be a point where profit or loss can be preserved or additional entry can be made by split trading. This is a short-term investment perspective.)
---------------------------------
AVAXUSDT 4HClassic rectangular formation caused in part by the triple bottom at 11.14. At the moment AVAX is licking the lower edge of the rectangular base and touching the lower line of the Keltner channel, in addition the stochastic RSI is indicating cooling of sellers which technically all indicates a good moment for Long.
From top to bottom AVAX has already corrected 92.40%, not long ago Defrost Finance, a decentralized leveraged trading platform on the Avalanche blockchain and investors reported the loss of AVAX tokens from MetaMask wallets.
A high-octane, feature-rich token, Alibaba Cloud has announced an integration with the Avalanche blockchain to power the company's Node-as-a-Service initiatives.
Follow support and resistance
S: 11.14 / 10.57
R: 11.53 / 11.90 / 12.68 / 14.37

long AVAX$AVAX is bouncing off the major support level on the 4h timeframe. Bullish movement to resistance level at 12$ is possible.

Sell Trade Set Up On AVAXUSDTDump ahead for avax as mentioned target 🎯 above in chart Lot more to come. This is not the financial advice.

AVAXVery simple ... Very clear!
Everything is marked on the chart.
This is my personal opinion. Please do not trade based on my analysis and data.

AVAX ANALYSIS#AVAX UPDATE.
#AVAX is facing huge resistance at the red box resistance area and got rejections on 4 TF.The current resistance for avax is the 20SMA on BB .The contraction of the BB suggesting some strong and flash move waiting ahead for avax .Do not enter in longs until avax close above the red box resistance.
