AVAX scaling into longhey, Im scaling into AVAX long, expecting a bounce on prev res ($26)... what do u think?
AVAXUSDT

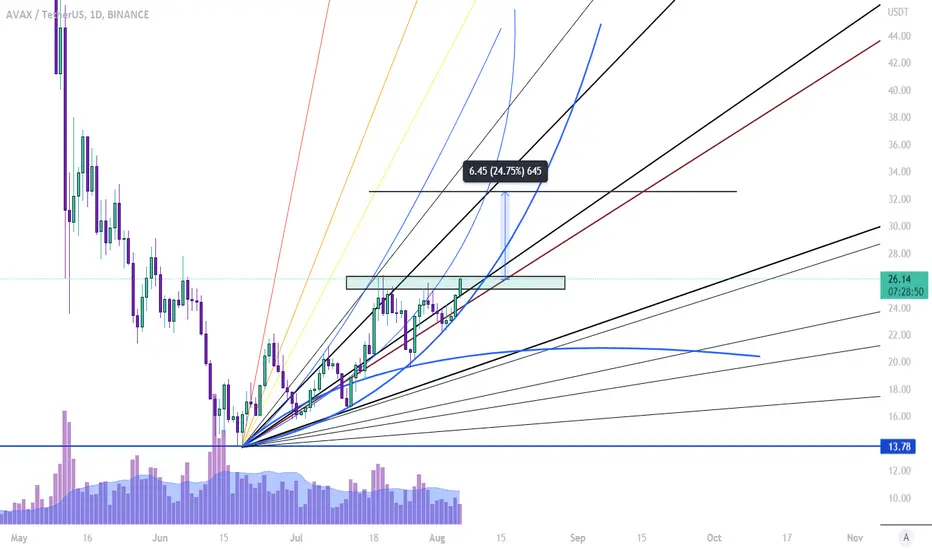
AVAXUSDT 1D Medium-term trade - our target $30We are already forming a series of ideas on the AVAXUSDT trading pair.
We published the last of them a week ago.
During the week, our assumptions are confirming that the AVAXUSDT trading pair is currently consolidating with a set of long positions. The trading delta shows the superiority of purchases over sales in the period from 06/26 to 07/13
Also, for almost a month, the Avax price has been consolidating above the critical support level above $15.
Such input data for Avalanche token price gives the right to enter a medium-term trade:
Entrance $16.50
Stop $14.54 (-12%)
TP1 (50% position) - $26.74 (+62%)
TP2 (50% position) - $29.94 (+82%)
P/L ratio 7/1
Fixing the AVAXUSD price below 15 dollars paves the way for the price to fall to the region of 12 dollars.
_______________________________
Since 2016 , we have been analyzing and trading the cryptocurrency market.
We transform our knowledge, trading moods and experience into ideas. Each "like under the idea" boosts the level of our happiness by 0.05%. If we help you to be calmer and richer — help us to be happier :)

AVAX- 27,65 Reached - Off to 50s Next? ♨️♨️Market becoming Bullish early this week as you have been informed:
I think this time is ok to FOMO on most crypto today but not AVAX yet:
US printing money to fight inflation.. take a wild guess what that can do to Bitcoin (🚀🚀🚀🚀).
BTC Technical analysis:
Still in ascending channel . The Top (resistance) is just below 25k . I see 70% chances of breaking over the channel and off to 28k Resistance (our first target as given few weeks ago).
Watch the video and take a look at THIS:
After the Falls we naturally get a lake
I think it ended up being Perfect.
One Love,
The FXPROFESSOR

AVAXUSD breakout, could this be the start of a new move higher?Hi, welcome to Monday's update. Today's focus is on AVAXUSD after last weekend's solid two days of buying that broke above resistance
Are we seeing a new higher extension on AVAXUSD? That is the question we're asking in today's video update. Weekend trade has set up the first sign with a break above 25.30 resistance. What we would like to see now is for the move to continue higher and test the next resistance levels seen at 27.50, 31 and 36.
In a perfect world, we would see price continue to push higher a bit more before we see a new pullback. We are looking for the pullback to find support at the previous breakout point and turn the previous resistance level into new support.
A new HL created around the previous level of resistance followed up by a new HH would be a good sign and could signal a buy into the new move. From that point, we would like to see buyers break 31 and 36 resistance to signal that a new short-medium-term trend higher is underway.
A new lower move closing below 25 would be a worry and could tell us that buyer momentum might not be as strong as thought.
Good trading, and enjoy the rest of your Monday.

Avalanche (AVAX) - August 8Hello?
Welcome, traders.
By "following", you can always get new information quickly.
Please also click "Like".
Have a good day.
-------------------------------------
(AVAXUSDT 1M Chart)
The key is whether it can rise above the 39.76-44.62 section.
To do that, you need to keep the price above the 15.44-20.30 range.
(1W chart)
Primary resistance: 30.03
Secondary resistance: 39.76-44.62
Support: 15.44-20.30
The intervals 15.44-20.30 and 39.76-44.62 are the intervals that determine the trend.
So, if you hold the price above 20.30, it is likely to move above 39.76.
To that end, the key is whether it can be supported by rising above 30.03 in the first place.
(1D chart)
Primary resistance: 27.95-30.03
Secondary resistance: 36.85-39.76
1st support: 23.72
2nd support: 15.44-20.30
The RSI and Stoch RSI indicators are entering the overbought zone.
Therefore, it is necessary to check where support and resistance are found when exiting the overbought zone.
If you fail to break above the 27.95-30.03 section, you should check to see if there is support around 23.72.
If it rises above 30.03 and finds support, it is likely to lead to a move towards the 39.76-44.62 section.
Therefore, the key issue is whether it can rise above 30.03 and receive support.
--------------------------------------
If you look at the 1M chart, you can see that there has been a huge decline.
Therefore, it is not easy to invest even if it shows an upward trend on the 1D chart.
However, if you are not investing now, it is highly likely that you will start investing when it rises to the 39.76-44.62 range.
The 39.76-44.62 interval is the interval that determines the trend.
So, if it moves above 44.62, it will continue its uptrend, but if it doesn't, it will go downhill.
The closer you get to this important support and resistance zone, the more likely the peak will be when you feel compelled to buy now.
Conversely, if you buy, the area that is more likely to decline is more likely to be the bottom.
Between this bottom section and the section where a full-fledged uptrend starts, it is a good section from a mid- to long-term point of view, no matter where you buy.
However, when a further decline occurs, it is important to secure adequate cash because a better opportunity may be missed due to a lack of cash.
In that sense, the method I recommend is
- Buy when the price moves sideways or when the price falls at a certain rate (for example, when it falls by -10% or -20%),
- When the price rises and receives resistance in the resistance section, sell when it rises at a certain rate (for example, when it rises by 10% or 20%).
This is a method to increase the number of remaining coins (tokens) with a small amount of cash profit by selling with the purchase principal (+ transaction fee x 2 ~ transaction fee x 20 included) when selling.
Cash management is important because this method has to be continued until the start of a full-fledged uptrend, so if you buy using too much cash at once, you may run out of cash.
Since the coin (token) secured in this way has an average purchase price of 0, it is always in a state of profit until the price becomes 0.
From a mid- to long-term perspective, the need to increase the number of coins (tokens) is to increase these coins (tokens).
------------------------------------------------------------ -------------------------------------------
** All descriptions are for reference only and do not guarantee a profit or loss in investment.
** The MRHAB-T indicator, which is inactive on the chart, contains indicators that indicate support and resistance points.
** Background color of Long/Short-S indicator: RSI oversold and overbought sections
** Background color of CCI-C indicator: When the short-term CCI line is below -100 and above +100, oversold and overbought sections are displayed.
** The OBV indicator was re-created by applying a formula to the DepthHouse Trading indicator, an indicator disclosed by oh92. (Thanks for this.)
(Short-term Stop Loss can be said to be a point where profit and loss can be preserved or additional entry through split trading. It is a short-term investment perspective.)
---------------------------------

AVAXUSDT Potential downsidesHey traders, in today's trading session we are monitoring AVAXUSDT for a selling opportunity around 28 zone, once we will receive any bearish confirmation the trade will be executed.
Trade safe, Joe.

AVAX / USDTAVAX broke swing high & formed a break of structure , waiting for a pullback taking place & the liquidity to be taking then we will see how gonna react from the OB

AVAX- Perfect Trade (but Coming to Resistance)AVAX has been great.
As you can see on this chart our Tradingview Alert and entry worked perfectly well.
The same as it did at 14.38: (Was a Great Time to load Bags indeed).
Unfortunately there will be a huge test for AVAX at 27.65 Resistance.
Will it be able to break higher?
Well..that depends on Bitcoin and the Crypto market as such.
One Love,
The FXPROFESSOR

Avalanche Coin What's next ? Hi Traders , please if you like ideas do not forget to support it with your like and comment , thank you so much and we will start stay tuned for new ideas. Every day I post profitable ideas a day.

AVAX/USDTInsights shown here are for follow-up purposes only.
Not Acceptable as ANY Investment Advice

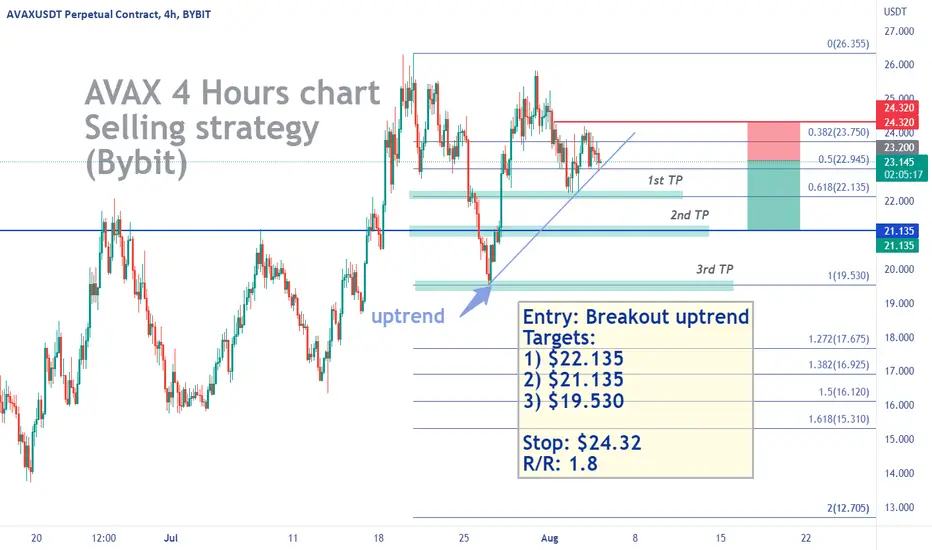
AVAX - Selling SignalBYBIT:AVAXUSDT
4 Hours chart
-
AVAX is forming a potential double top here, and is getting support from the uptrend.
Short is while breaking out the uptrend, and targets as below.
-
Targets:
1) 22.135
2) 21.135
3) 19.53
Stop: 24.32
RRR: 1.84
Risky Trade - AVAX LongToday`s trading idea is based on AVAX and going long with strict risk applied to it, and the ability to use leverage to your advantage. This trade might be a bit too risky for some of you , but for those that don't shy away from taking a bit extra on their accounts, it can be a great idea and way to generate a bit extra right before the holiday season in August
Long AVAX/USDT x10
➡️Entry: 23.48
✅Targets: 24.01(50%) - 24.59(25%) - 25.30(25%)
❌SL: 22.99

AVAXusdtMarket in our orange buying zone with good potential bulls impulsive wave RR 3:1 after III sequence

AVAX's DCA Zone ( Gem's edition)Most experts believe that AVAX has a very bright future. The coin is well-positioned to take advantage of the growing DeFi market, and its unique governance model could make it a leading player in the space.
After years of analysis of the Avalanche price, crypto experts are ready to provide their AVAX cost estimation for 2030. It will be traded for at least $762.81, with the possible maximum peaks at $935.55. Therefore, on average, you can expect the AVAX price to be around $790.27 in 2030.
Well we'll see where it goes in the next bull run.
Is it a gem of a token?!

AVAX BULLISH SOON?From an analyst standpoint, there is a chance that the crypto market seems to be making a correction as sell-side delta has accumulated heavily and we might be due to seeing a short squeeze soon.
Avax looks to be heading down to the bullish trendline area I am looking at those Fibonacci levels as a potential entry but also be aware price may manipulate the daily trendline to take out buy stops and move up.
