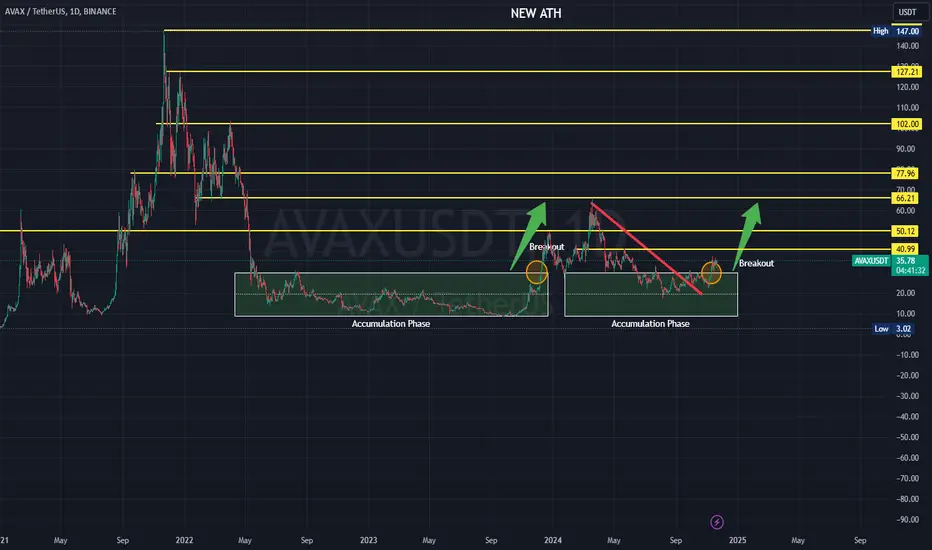
AVAX SWING LONG IDEA - ALTCOIN SEASON AVAX is one of the most well-known coins, with strong fundamentals. I believe it will perform well during the 2024-2025 bull run.
The price is coming from the monthly demand zone, showing solid rejection and strength. It also broke the diagonal trendline responsible for the bearish trend. The weekly momentum is strongly bullish, and the daily momentum is also bullish, supported by Bitcoin's strength.
The price may form a small range here before taking off straight toward the purple targets.
I’ve bought a spot position here and will be holding it all the way to new highs and targets above.
AVAXUSDT

Trading opportunity for AVAXUSDTBased on technical factors there is a Buy position in :
📊 AVAXUSDT
🔵 Buy Now
🪫Stop loss 42.90
🔋Target 1 57.25
🔋Target 2 66.00
🔋Target 3 79.00
💸RISK : 1%
We hope it is profitable for you ❤️
Please support our activity with your likes👍 and comments📝


Avalanche AVAX/USDT - Long Trade 🌟AVAX/USDT
Entry Price= $45.60🟢
Stop Loss= $43.75🔴
Target= $47.90🎯💸
‼️disclaimer please read carefully‼️
*(this not financial advice, always do your own research! i am not responsible for any loss of earnings from any investments that you may make based off any of my ideas. only invest what you can risk to afford to lose if you make the decision to do so. do not invest, unless you're prepared to lose money, if not all.)
(cryptocurrency can be high-risk investments due to the volatillity of it's nature, and you should not expect to be protected if something goes in the wrong direction. seek professional advice from a certified financial advisor.)

AVAXUSD - This Bull Run TargetAssuming the same length of bull markets to the 2020 - 2021 for AVAX.
This assumption allows for another up move before the bull run is over
% increase tool shows my price target for this run, also with the bars pattern


#AVAXUSDT Preparing For a Massive Move After the Breakout Yello, Paradisers! Is this the moment #AVAX finally makes its comeback after months of struggle? Let’s break down the # Avalanche's latest analysis:
💎After 4-5 months of a downtrend, #AVAXUSDT has managed to break out of a Descending Channel, thanks to strong support at $22.82. This could be the much-needed turning point, but we’re not out of the woods just yet.
💎For this rally to truly gain steam, #AVAX needs to clear the resistance zone at $30.50-$32.80, which was previously support. If it breaks above this level, we could see a stronger push toward the next major resistance, backed by increasing volume and the 20EMA, signaling that bulls might be in control.
💎If momentum fades, watch for a pullback to retest the breakout zone near $22.82. A failure to hold this support could send #AVAX back toward the lower demand zone at $20.47.
💎A break below $20.47 would hand control back to the bears, likely leading to a deeper correction and wiping out any hopes of a bullish recovery in the short term.
Stay focused, patient, and disciplined, Paradisers🥂
MyCryptoParadise
iFeel the success🌴

Avalanche (AVAX) - Ascedning Channel PatternChart shows trend lines ascending with Higher Highs on Resistance & Higher Lows with the Support recently of "$40" that still held for the bulls!🟢👀
Target= $46.90

AVAXUSDT: Growth Potential Within an Ascending Channel
BINANCE:AVAXUSDT is showing confident movement within an ascending channel, indicating a strong bullish trend. The current price is 40.337 USDT , with nearby support and resistance levels offering excellent opportunities for trading with high profit potential.
The chart highlights key levels, including volume zones, making this asset particularly appealing for both beginner traders and experienced market participants.
🔑 Key Levels
Support:
37.092 USDT – the lower boundary of the channel where buyers actively defend positions.
37.673 USDT – a short-term support zone during local corrections.
Resistance:
40.489 USDT – the current resistance level being tested by the price.
49.427 USDT – the upper boundary of the channel, serving as the target for bullish movement.
These levels play a crucial role in position management and planning trade entries and exits.
🚩 Trade Setup
The chart shows increased trading volume accompanying the price's upward movement. This confirms buyer activity and strengthens the likelihood of further growth.
Entry Point: Consider opening a long position upon a breakout above 40.489 USDT .
Stop-Loss: Set a protective stop order below 37.092 USDT to limit potential losses.
Take-Profit Targets:
43.500 USDT – the first target where partial profit-taking is recommended.
46.800 USDT – an intermediate target for securing the majority of the position.
49.427 USDT – the final target at the upper boundary of the channel.
📈 Technical Analysis Context
The price is currently in the middle of the ascending channel, suggesting the possibility of both further growth and short-term corrections.
Increasing volume in support and resistance zones enhances the reliability of these levels.
A breakout above 40.489 USDT could signal the start of a new bullish impulse.
💡 Trader Recommendations
Utilize volume analysis: Rising volumes at key levels confirm their significance.
Watch for breakouts: If the price consolidates above resistance, expect an acceleration in growth.
Plan positions in advance: Set take-profit and stop-loss orders beforehand for effective risk management.
Analyze dynamically: Use timeframes (1H and 4H) to get a complete market picture.
Conclusion
BINANCE:AVAXUSDT offers unique trading opportunities thanks to its clearly defined ascending channel and significant volume activity. Use the presented levels and recommendations to optimize risk management and maximize profits.

Avax/UsdtBINANCE:AVAXUSDT
### **$AVAX/USDT Price Analysis Update 🚨**
#### **Current Price: $41.23**
- **Support Level: $37.34**
- Avax is currently priced at **$41.23**. The immediate **support level** you're watching is **$37.34**. If the price fails to hold above this support, the next levels to watch are **$31.34 / $30**, which could be tested if the selling pressure increases.
- **Bearish Scenario:**
- If Avax fails to hold **$37.34**, it could drop towards the **$31.34** or even the **$30** level. These would be key areas to watch for potential price stabilization or further downside.
- **Resistance Level: $45.34**
- If the price holds above **$37.34** and respects the trendline, Avax could face its next resistance at **$45.34**. This would mark a potential breakout point and the next key area to monitor for a possible price rally.
#### **Trendline and Key Levels:**
- The **trendline** you're referring to is crucial for determining whether the price will hold the support level or break down lower.
- **If the trendline holds** and ADA respects the support at **$37.34**, there is a potential for a move toward the **$45.34 resistance**.
#### **Action Plan:**
- **Watch the $37.34 Support**: This is the key level for deciding the near-term direction. If it holds, there’s potential for a rally toward resistance.
- **Bearish Breakdown Possible Below $37.34**: If the price breaks below **$37.34**, the next potential targets are **$31.34 / $30**.
---
### **Conclusion:**
- **$37.34** is a crucial support level for Avax. If the price breaks below it, we may see a drop towards **$31.34 / $30**. However, if **$37.34** holds and the trendline is respected, Avax could push toward the next resistance at **$45.34**.
### **Reminder:**
This analysis is based on current market conditions, and it's important to keep an eye on price action as it develops. Always consider risk management before making any trading decisions.

btcusdtLet's not skip the possibilities
The country's budget deficit and rampant inflation are such that even Elon Musk admitted that America is going bankrupt. Be careful in your transactions.

AVAX USDTAVAX is approaching its final resistance level. A further push of about 22% could clear the way, leaving no obstacles and leading it into a new price discovery phase. At the same time, its potential peak is uncertain.

Avalanche Avax price entered the buying zone 4 months ago, all those who chose the 🔴 "red pill" 💊 were right.
OKX:AVAXUSDT price has dropped to the buying zone of $18.7-23.7
So, if you believe in #Avalanche project, the CRYPTOCAP:AVAX price now is "tasty" with the prospect of growth at least x2 by the end of the year.
_____________________
Did you like our analysis? Leave a comment, like, and follow to get more

AVAXUSDHello everyone,
today let's talk about AVAX.
AVAX has already made a 4x from its low at 8.5 USD in 2023. However, it is still far from ATH in 2021 so it still has room to grow.
AVAX has shown great respect for 20 USD price and has bounced of it wonderfully, creating a higher low both in price action and in RSI. Currently price is at 32 USD, a previous local high from end of July. If it breaks it to the upside next major resistance is at 55 USD.
RSI also broke over 50 - a bullish sign.
I expect it to go higher in this bull run, however in short term we might witness a pullback to previous level of 20 USD.
Also on AVAXBTC pair chart is coming close to strong base of 0.0003 (currently is around 20% above this).
I expect one of 2 scenarios:
- BTC pulls higher while AVAX stalls for a moment, bringing AVAXBTC to 0.0003 and then AVAX starts following, gaining on BTC.
- Both face a pullback, but AVAX bleeds more. AVAXBTC drops to 0.0003, AVAX drops to 20 USD and then they both bounce, AVAX gaining momentum against BTC.
There are also other possible scenarios, so do take my analysis with a grain of salt and DO YOUR DILLIGENCE.
My strategy:
I will be buying a small portion of AVAX at this price. I will also buy some more if we dip towards 20 USD. In total I will dedicate only a small portion of my portfolio to this pair.
If AVAX falls below 15 USD, I am out and will take a hit.
Good luck.

AVAXUSDT Approaching Ascending Triangle ResistanceAVAXUSDT Technical analysis update
AVAXUSDT is forming an ascending triangle in the middle of an uptrend. The price is currently moving towards the triangle's resistance, with the 100 EMA acting as support at the triangle's bottom on the 4-hour chart. Once a breakout occurs, a strong bullish move can be expected in AVAX.
Buy Level: Above $37.00
Stop Loss: 33.00

Avalanche (AVAX) Price Technical AnalysisAvalanche AVAX ⬆($42.90) broke above the resistance line of the ascending channel pattern on Nov. 22, indicating that the bulls have overpowered the bears.
If the price sustains above the resistance line, the AVAX/USDT pair could surge to $48 and futhermore past $50.
This positive view will depend in the near term if the price turns down and breaks below ($40.00). Such a move will signal that the breakout may have been a bull trap. The price may then dip to the ($35.00), extending the consolidation inside the channel for some more time.

avaxavax technical analysis basically on elliott waves Principles and priceaction strategy
avax can be grow up to 100$
wait and watch.

AVAXUSDT Market On The MoveBINANCE:AVAXUSDT moved out of the consolidation zone that was formed around 35.00.
The price surged, showing bullish strength taking out short sellers.
In the long run, the market is on the process of forming ABCD.

#AVAX - Latest Long IdeaNow is the time to pack your #AVAX spot bags before the next level of 42$
You may also want to start your longs if you're doing day trading
Check out the labels for more information!
Follow for more daily analyses!

AVAX thesis with RAG AI by Titan_KarmaThe current market conditions for AVAXUSDT indicate a favorable environment for entering a long position, particularly given the absence of open positions and the strong bullish sentiment reflected in the long-short ratio exceeding 4. The price is currently at $38.04, with a significant trading volume of approximately 2.2 million, suggesting robust market activity. Despite the lack of recent news, the prevailing sentiment among traders leans towards bullishness, which could provide a solid foundation for potential upward movement in the price of AVAX.
From a technical analysis perspective, the indicators suggest that AVAX is experiencing strong bullish momentum. The RSI values are above 70, indicating overbought conditions, while the Stochastic indicators are also high. This suggests that while the market is currently bullish, caution is warranted as the price approaches key resistance levels at $39.08 and $40.12. Traders should be prepared to take profits or set stop-loss orders to protect gains, especially if the price fails to break through these resistance levels.
Historically, AVAX has shown a significant upward trend, particularly from mid-November 2024, where the price increased from around $33.60 to $38.17. The high volume of taker buy quote asset volume indicates strong buying interest, reinforcing the potential for further price appreciation. A buy position may be advisable if the price remains above $37.00, with a stop-loss set around $36.00 to manage risk effectively. Monitoring for signs of reversal or increased selling pressure will be crucial in adjusting the trading strategy.
In terms of volatility analysis, the Average True Range (ATR) and Bollinger Bands indicate that the market is currently experiencing moderate volatility. This suggests that traders should be cautious about entering positions during periods of sudden price movements. The order book dynamics reveal significant buy walls, which could signal imminent price increases, while price action signals indicate potential breakout opportunities. Traders should remain vigilant for any candlestick patterns or chart formations that could indicate strong movement potential.
Finally, the historical trade analysis shows a mix of outcomes, with some trades resulting in profits while others did not yield favorable results. Notably, trades with confidence levels of 85% and 87% previously resulted in no profit, highlighting the need for a more disciplined approach to risk management. Setting appropriate stop-loss orders based on historical performance and volatility will be essential in managing risk effectively. The current market sentiment, combined with technical indicators and historical performance, suggests a cautious yet optimistic approach to entering a long position in AVAX.
TRADE RECOMMENDATION
json { "OUTCOME": "OPEN_LONG", "STOP_LOSS": "$36.00", "TAKE_PROFIT": "$39.08", "CONFIDENCE_LEVEL": "80%", "EXIT_POINT": "$38.50", "ENTRY_CRITERIA": { "TIMEFRAME": "1h", "RSI": "above 70", "MACD": "above 0, 1h" }, "CURRENT_OPEN_LONG_POSITIONS": 0, "CURRENT_OPEN_SHORT_POSITIONS": 0 }

Avalanche AVAX Is Entering The Most Impulsive Super Cycle StageHello, Skyrexians!
Today we have the easiest for analysis altcoin in our opinion, this is BINANCE:AVAXUSDT . Previous bull run was very impulsive and after severe bear market this crypto is showing great dynamic. Today we will try to understand the targets for Avalanche for this bull run.
Let's take a look at the weekly time frame. The previous bull run can be interpret as the global wave 1. It has the clear 5 waves impulsive structure. After that price went to corrective wave 2 which has ABC zigzag structure. When 0.61 Fibonacci retracement has been reached price started to reverse.
Now AVAX is in the global wave 3 - the most impulsive wave of super cycle which can bring the highest gains with lowest risks. Wave 1 in wave 3 has been finished with the red dot on Bullish/Bearish Reversal Bars Indicator . As always, alerts from this indicator can be automatically replicated on exchange account orders. You can find the information in our article on TradingView .Then wave 2 showed us the pull back, which has been finished with the green dot on this indicator. This is the very strong reversal signal which will likely bring the price to the global wave's 3 targets at 1.61 and 2.61 Fibonacci extensions at $260 and $400.
Best regards,
Skyrexio Team
___________________________________________________________
Please, boost this article and subscribe our page if you like analysis!

AVAX on the verge of a big move🔍 AVAX has recently completed a 3-wave correction and is currently in wave C. Waves A and B are finished, and now we're approaching the critical $30 level. This area is significant, both technically as a strong support level and because it's aligned with the neckline of the inverse head and shoulders pattern.
🔄 The neckline often acts as a potential pullback zone after being broken, and this pullback could occur around $30, creating an ideal entry point. If the price reaches this level, we could see a powerful upward move starting.
📈 If this pump happens, we can expect wave 3 to kick off, which will likely be a strong and bullish move. For those looking for solid entry opportunities, this could be a very attractive level to watch.
⚡ Always be mindful of market fluctuations and indicator signals. Overall, the $30 level could be a turning point, initiating a major bullish trend. Don’t miss out on this opportunity!
