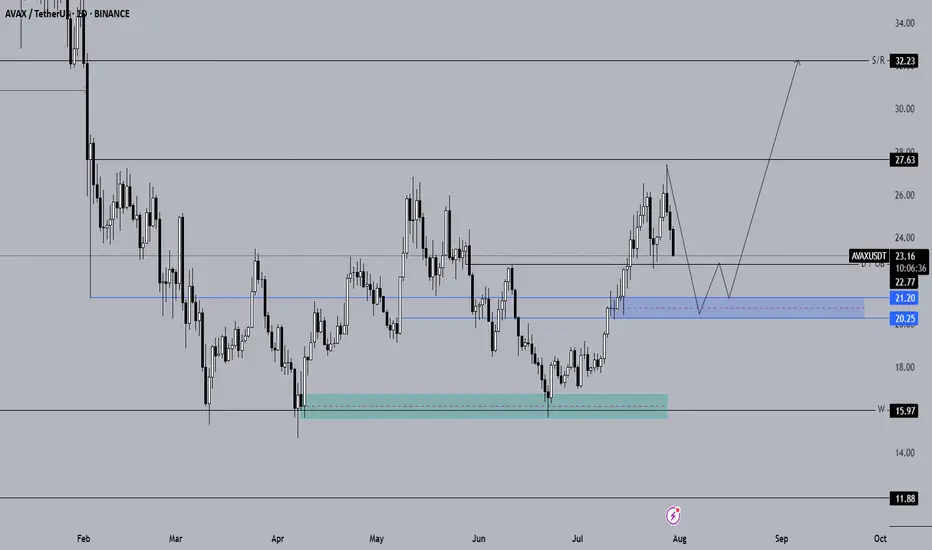
Long-Term Technical Analysis of AVAX CoinWhen evaluating AVAX for long-term investments, the blue support zone highlighted on the chart stands out as the key area to monitor for potential spot entries. If AVAX closes daily candles below the $22.77 level, it is expected to continue its downward trend.
The primary spot buy zone for AVAX is identified between the $21.20 – $20.25 support range. If the price retraces into the blue zone on the chart, we plan to initiate spot positions. Should AVAX show a reversal from this area, our next upside targets are $27.63 and $32, respectively.
If AVAX fails to generate a strong reaction from the blue zone and continues to decline, we will then monitor the $18 support level. As long as AVAX holds above $18, our bullish outlook from this analysis remains valid.
Not Financial Advice (NFA).
Avaxusdtanalysis
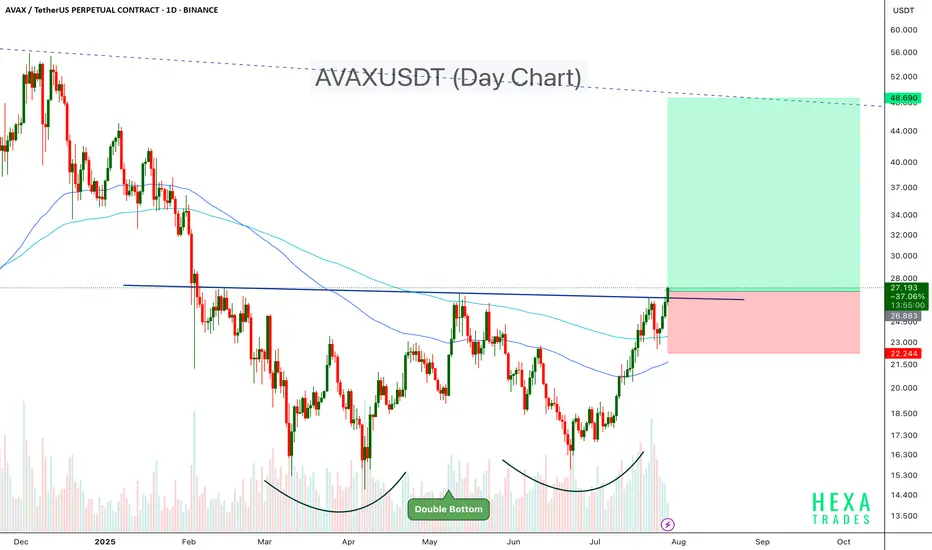
AVAXUSDT Double Bottom Confirmation.AVAX has formed a textbook double bottom pattern on the daily chart, signaling a potential reversal after months of downtrend. The neckline around the $27 zone has been broken decisively, confirming the bullish breakout.
Key Points:
- Double Bottom Structure: A strong bullish reversal pattern with a clean neckline breakout.
- Breakout Level: $27, which was acting as resistance for the past several weeks.
- Volume Surge: Noticeable increase in volume during the breakout, adding strength to the move.
- Target: $48–$50 region. ( Channel resistance)
-Stop-Loss Idea: Below $22.0
AVAX appears ready to trend higher as momentum builds. If bulls hold above the breakout zone, the rally may accelerate in the coming weeks.
Cheers
Hexa
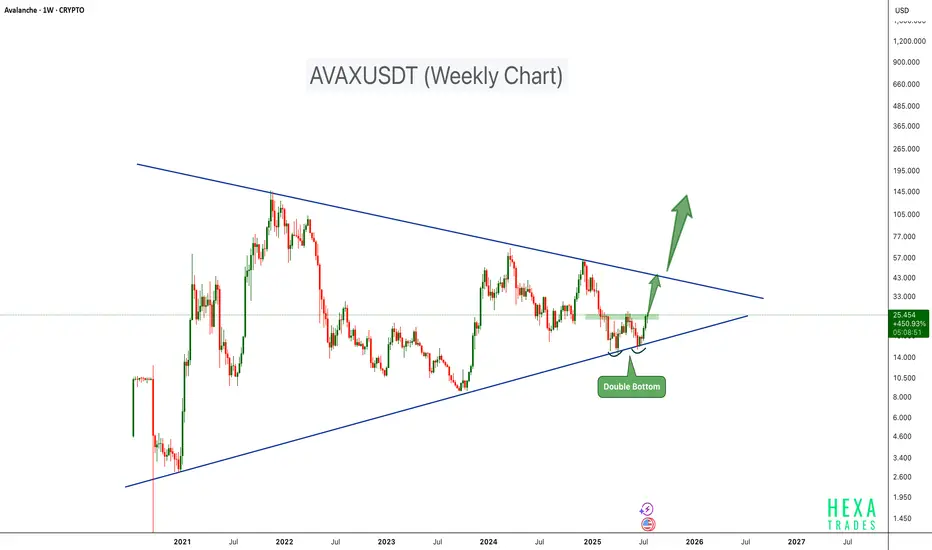
AVAX Bull Run Loading!AVAX is showing signs of a strong bullish setup on the weekly chart, forming a double bottom pattern right at the lower support trendline of a long-term symmetrical triangle. This technical formation often indicates a potential trend reversal when confirmed with breakout and volume support.
Key Points:
-Double Bottom Support around $12–$14 with bullish momentum.
-Symmetrical Triangle structure compressing price for breakout.
-Breakout Zone near $27, a close above this level may trigger strong upside.
-Upside Target: Short-term Target- $45; Long Term Target - $125
Invalidation: A Break below $15 support could negate the setup.
Cheers
Hexa
CRYPTOCAP:AVAX BINANCE:AVAXUSDT
AVAX/USDT Trade Setup: Bullish Bias with Fibonacci Targets🚀 AVAX/USDT Avalanche is currently in a strong bullish trend 🔼. On the 4H chart, price is pulling back slightly 📉, and I’m watching for momentum to pick up and break above the current range high 📊—that’s where I’ll be looking for the next entry.
🎯 My bias remains long, and in the video I break everything down in detail:
🔍 Price action
🧱 Market structure
📈 Overall trend
📍 Stop loss placement (below the previous swing low)
🎯 Targeting key Fibonacci levels
I also go over my exact Fibonacci settings and how I use them to frame the trade.
This is not financial advice ❌💼

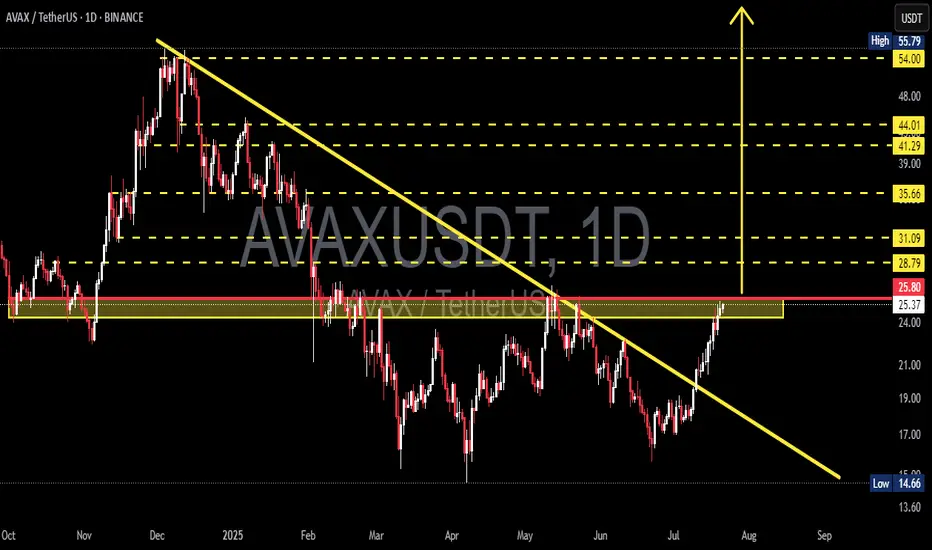
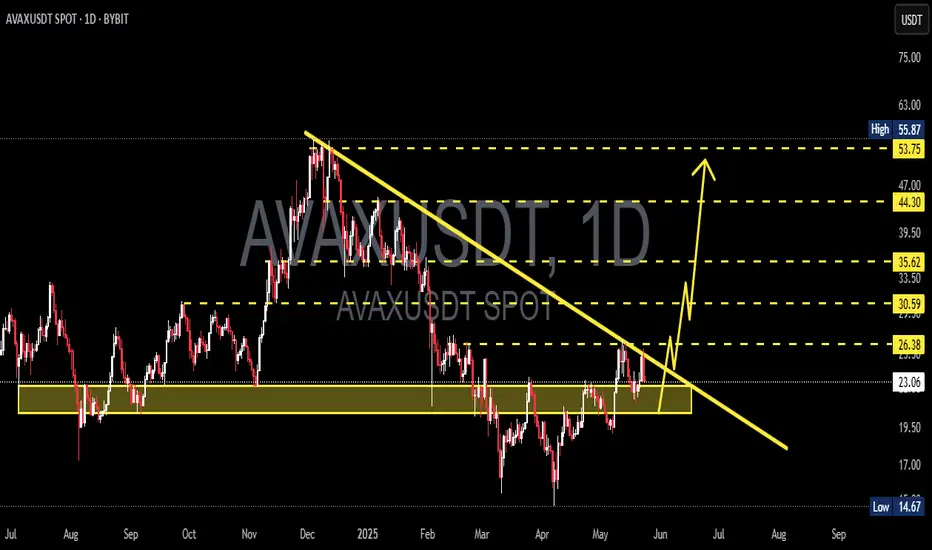
AVAX/USDT Massive Trend Reversal: Breakout from 8-Month DowntrenAVAX has just delivered one of its most technically significant moves in recent months. After spending over 8 months trapped under a descending resistance line, price action has finally broken free — suggesting a potential trend reversal and the beginning of a much larger bullish phase.
🧠 Pattern & Structure Breakdown:
📌 Descending Trendline Breakout
AVAX had been forming a descending triangle pattern, characterized by consistent lower highs and a horizontal support zone between $14.66 – $22. The recent bullish breakout from this structure, accompanied by strong volume, is a highly encouraging sign for bulls.
📌 Accumulation Zone Identified
The yellow zone on the chart ($14.66 – $22) has proven to be a strong demand zone where buyers consistently stepped in. The recent rally originates from this base, indicating possible institutional accumulation.
📌 Critical Horizontal Resistance at $25.80
Price is now testing the $25.80 resistance zone, which historically acted as a supply area. A successful daily close and confirmation above this level would officially flip the structure bullish.
📈 Bullish Scenario – Multi-Level Upside Targets:
If AVAX confirms the breakout above $25.80, these are the key bullish targets ahead:
🎯 Target 1: $28.79 – minor resistance & potential short-term TP zone
🎯 Target 2: $31.09 – previous price equilibrium
🎯 Target 3: $35.66 – key pivot from past market structure
🎯 Target 4: $41.29 and $44.01 – heavy historical supply zones
🎯 Target 5 (measured move): $54.00 to $55.79 – the projected breakout target from the descending triangle pattern
This move would represent a full technical recovery if AVAX aligns with broader market sentiment and Bitcoin remains stable or bullish.
📉 Bearish Scenario – Pullback Risks:
On the flip side, if price fails to sustain above $25.80 and gets rejected:
⚠️ A retest of $24.00 – $22.00 is likely
⚠️ If that zone breaks down, next support lies at $19.00 – $17.00
⚠️ A loss of the $17 level may trigger a return to the critical low near $14.66
This would invalidate the bullish breakout and return AVAX into a sideways or downward consolidation phase.
🔍 Additional Technical Insights:
✅ Volume is steadily increasing — showing renewed buying pressure
✅ Indicators like RSI and MACD (if applied) are likely showing bullish divergence
✅ Overall altcoin sentiment is improving, providing a tailwind for AVAX's potential breakout continuation
🧩 Final Thoughts:
AVAX is at a pivotal moment in its medium-term price structure. The breakout above the long-term downtrend line is a strong technical shift. A confirmed breakout and hold above $25.80 could trigger a multi-week or multi-month rally targeting $40 – $55+.
However, traders should be cautious of possible pullbacks and manage risk accordingly — especially as resistance zones from previous structures are being tested.
#AVAX #AVAXUSDT #CryptoBreakout #TechnicalAnalysis #Altcoins #BullishCrypto #DescendingTriangle #ReversalPattern #AVAXAnalysis
AVAX (Avalanche) Breakout? Here’s My Trade Plan.📊 Market Breakdown: AVAX/USDT (Avalanche)
Currently monitoring AVAX/USDT, and both the daily and 4-hour timeframes are showing a clear bullish break in market structure — a key signal that the momentum may be shifting to the upside.
That said, I’m not jumping in just yet. I’m only looking for long opportunities if specific criteria are met:
✅ A clean break above a key resistance level
✅ A retest of that level, followed by a failed attempt to move lower
If these conditions are confirmed, I’ll be watching for a high-probability entry from that zone.
🎥 In the video, I also walk through how to use several powerful TradingView indicators, including:
Volume Profile
VWAP
These tools help sharpen the edge and support decision-making in live market conditions. If the setup doesn’t materialize as expected, we simply stand aside — discipline is key.
📌 Disclaimer: This is not financial advice, just a breakdown of how I approach this potential opportunity.

AVAX/USDT Weekly Reversal Zone — Major Support Holding
🟨 CRITICAL ZONE (Key Support Area)
AVAX is currently trading within a major demand zone between $13.5–17.5, a historically strong support area that previously acted as the base for significant upward movements. Multiple weekly candles show rejection from this level, indicating buyer interest.
📊 Pattern Overview:
Double Bottom / Potential Triple Bottom:
The chart illustrates a clear double bottom structure, potentially forming a triple bottom, suggesting accumulation and reversal from the lows.
Bullish Projection Path:
The yellow arrow outlines a projected bullish impulse wave, targeting higher resistance levels if support holds.
📈 Bullish Scenario:
If AVAX maintains support at around $17.1:
1. Price may first test $20.25 (initial resistance).
2. A breakout above $20.25 could open the way to:
$24.98 (strong weekly resistance)
$32.75 (previous distribution zone)
$55.42 (major target/resistance zone)
3. In an extended bullish cycle, price could revisit:
$98.87, $110, and even $128.62 long term (2026+)
A confirmed breakout above $25 with strong volume would further validate the bullish case.
📉 Bearish Scenario:
If the $15–17 support zone breaks down:
1. Price could drop further to:
$11.00 (minor support)
$8.61 (historical low and weekly support)
2. This would indicate strong bearish pressure, potentially leading AVAX into a longer-term accumulation phase.
🔍 Conclusion:
This is a critical decision zone for AVAX. The technical structure shows signs of accumulation and possible trend reversal. However, if support fails, a deeper retracement could occur. Traders should watch this area closely for breakout or breakdown confirmations.
#AVAX #AVAXUSDT #Avalanche #CryptoReversal #TechnicalAnalysis #Altcoins #WeeklyChart #CryptoSupportZone #CryptoBreakout

AVAXUSDT 1W AnalysisAVAX ~ 1W Analysis
#AVAX Buy from here if you still have confidence in this coin with a short term target of at least 20%+, long term target $55

Avalanche (AVAX) Price at Key Resistance – Potential Short Setup📉 AVAX/USDT – Possible Bearish Setup Developing 📉
Currently watching Avalanche (AVAX) paired with USDT 🔍, and price action is starting to show signs of bearish momentum creeping in.
We’ve seen a subtle shift to the downside, and I'm anticipating the potential for further weakness into the end of the week 📆🔻.
Here’s what I’m looking for:
🔹 A pullback into resistance — specifically the level highlighted in the video
🔹 A rejection and failure to break above that resistance zone
🔹 A bearish break of market structure following the rejection
If these conditions are met, I’ll be considering a short opportunity aligned with the developing trend 🔄📊.
🎯 As always, patience and precision are key — I’m not acting until price confirms the setup.
⚠️ Disclaimer: This is not financial advice. The content shared is for educational purposes only. Always conduct your own analysis and manage your risk appropriately.

$AVAX Update – Breakout Retest Play!!CRYPTOCAP:AVAX is respecting the ascending trendline beautifully after a clean retest of the breakout zone.
The price is holding above the trendline, and the 200 EMA is in the 4H timeframe.
Multiple confluences align around the $22.5–$23 zone – a critical support area now flipped from resistance.
Targets are set at:
• 26.81
• 29.47
• 33.40
As long as we hold this support, the upside potential remains strong.

AVAXUSDT 1D AnalysisAVAX ~ 1D Analysis
#AVAX Buy gradually from here if you still have confidence in this coin with a short term target of at least 10%+ from here.
AVAXUSDT 1DAVAX ~ 1D Analysis
#AVAX Buy after successfully penetrating this resistant line with a short -term target of at least 10%+.

AVAX Is Ready For Big Storm !!!Avax forming a big symmetrical triangle on weekly time frame & currently is sitting on big symmetrical support...
Although currently is in macro 2nd wave which seems to be end...
Soon we may see big moves in Avax storming straight out of triangle, targeting first at 104$ and 2nd around 500$ which aligns which triangle target along with macro 5th wave...

#AVAXUSDT: Three Swing Buy Take Profit EntriesThe cryptocurrency market has experienced volatility in recent months, particularly with the #AVAXUSDT token. We have identified two potential price reversal points:
1. **Current Price Range:** The market is currently experiencing a surge in volume, indicating a potential reversal.
2. **Liquidity Removal and Reversal:** If the price were to remove liquidity and subsequently reverse at its previous low, it could trigger a significant price drop.
Additionally, we recommend setting three targets based on your analysis to guide your trading decisions.
We extend our sincere gratitude for your unwavering support since the beginning. We anticipate that this support will continue to grow and evolve.
Team Setupsfx_
🚀❤️

AVAXUSDT 1WAVAX ~ 1W Analysis
#AVAX Buy gradually from here if you still have a Conviction on this coin with a short -term target of at least 20%+.

AVAXUSDT Breakdown Alert – Are Lower Lows Coming Next?Yello, Paradisers! Is AVAXUSDT gearing up for a bigger drop? Let’s break it down.
💎AVAXUSDT has turned bearish after breaking below its key support trendline. A Change of Character (CHoCH) confirms the shift to the downside, and right now, the price is rejecting from a critical 4H Fair Value Gap (FVG) and the 200 EMA resistance zone. Adding to the bearish pressure, we also see a 4H bearish divergence, making a downside move highly probable.
💎Moreover, AVAXUSDT is in the process of forming a Head & Shoulders pattern, which increases the risk-to-reward (RR) potential for short trades. On top of that, there’s liquidity resting below, which could act as a magnet, pulling the price further down.
💎However, if the price breaks out and closes a candle above the 200 EMA resistance zone, this bearish outlook will be invalidated. In that case, it’s better to wait for clearer price action before making any moves.
🎖Patience is key, Paradisers. Stick to the strategy, avoid emotional trading, and let the market come to you. The best setups will always present themselves to those who wait!
MyCryptoParadise
iFeel the success🌴

AVAXUSDT 1WAVAX ~ 1W Analysis
#AVAX Buy gradually from here if you still have a Conviction on this Coin. with a minimum target of 20%+.

LITUSDT: Buyers Are Stepping In – Big Moves on the Horizon!The Chart Is Heating Up – Prepare for a High-Profit Opportunity
"LITUSDT is showing buyer activity, and let me tell you, this could be the start of something big. The market is alive, and smart traders are paying attention!"
What I See:
Blue Box Potential: The chart isn’t fully mature yet, but when CDV aligns, a lower time frame breakout happens, and volume profile confirms, the blue box becomes a golden opportunity for entry. This is how real gains are made.
Perfect Timing Matters: We don’t jump in without confirmation – precision and patience are the keys to success. Wait for the breakout, let the market show its hand, and then strike!
Key Points:
"As always, I’m watching CDV, volume profile, and liquidity heatmap closely to ensure every move is calculated. No guessing, just data-driven decisions."
LITUSDT is shaping up beautifully. This could be a chart for the books, so get ready to make moves with confidence. 🚀
Let me tell you, this is something special. These insights, these setups—they’re not just good; they’re game-changers. I've spent years refining my approach, and the results speak for themselves. People are always asking, "How do you spot these opportunities?" It’s simple: experience, clarity, and a focus on high-probability moves.
Want to know how I use heatmaps, cumulative volume delta, and volume footprint techniques to find demand zones with precision? I’m happy to share—just send me a message. No cost, no catch. I believe in helping people make smarter decisions.
Here are some of my recent analyses. Each one highlights key opportunities:
🚀 RENDERUSDT: Strategic Support Zones at the Blue Boxes +%45 Reaction
🎯 PUNDIXUSDT: Huge Opportunity | 250% Volume Spike - %60 Reaction Sniper Entry
🌐 CryptoMarkets TOTAL2: Support Zone
🚀 GMTUSDT: %35 FAST REJECTION FROM THE RED BOX
🎯 ZENUSDT.P: Patience & Profitability | %230 Reaction from the Sniper Entry
🎯 DEXEUSDT %180 Reaction with %9 Stop
🐶 DOGEUSDT.P: Next Move
🎨 RENDERUSDT.P: Opportunity of the Month
💎 ETHUSDT.P: Where to Retrace
🟢 BNBUSDT.P: Potential Surge
📊 BTC Dominance: Reaction Zone
🌊 WAVESUSDT.P: Demand Zone Potential
🟣 UNIUSDT.P: Long-Term Trade
🔵 XRPUSDT.P: Entry Zones
🔗 LINKUSDT.P: Follow The River
📈 BTCUSDT.P: Two Key Demand Zones
🟩 POLUSDT: Bullish Momentum
🌟 PENDLEUSDT.P: Where Opportunity Meets Precision
🔥 BTCUSDT.P: Liquidation of Highly Leveraged Longs
🌊 SOLUSDT.P: SOL's Dip - Your Opportunity
🐸 1000PEPEUSDT.P: Prime Bounce Zone Unlocked
🚀 ETHUSDT.P: Set to Explode - Don't Miss This Game Changer
🤖 IQUSDT: Smart Plan
⚡️ PONDUSDT: A Trade Not Taken Is Better Than a Losing One
💼 STMXUSDT: 2 Buying Areas
🐢 TURBOUSDT: Buy Zones and Buyer Presence
🌍 ICPUSDT.P: Massive Upside Potential | Check the Trade Update For Seeing Results
🟠 IDEXUSDT: Spot Buy Area | %26 Profit if You Trade with MSB
📌 USUALUSDT: Buyers Are Active + %70 Profit in Total
🌟 FORTHUSDT: Sniper Entry +%26 Reaction
🐳 QKCUSDT: Sniper Entry +%57 Reaction
📊 BTC.D: Retest of Key Area Highly Likely
This list? It’s just a small piece of what I’ve been working on. There’s so much more. Go check my profile, see the results for yourself. My goal is simple: provide value and help you win. If you’ve got questions, I’ve got answers. Let’s get to work!

AVAX LongAvax bounced at 34.50, where there's strong support= EMA 200 on the daily chart. At the moment, we have broken the trendline and are currently testing prev week mid and monday mid also previous small rezistance.
If we manage to hold, I expect the price to shoot up to 38.96, and from there, I anticipate the price will go back to test the level of 37.68. If it holds, I’ll be opening a trade.
If you want you can buy now: TARGET - 38,90
SL- 37,09

AVAXUSDTBuilding Volume for a Potential Move
AVAX is showing strong accumulation signs, with increasing trading volume and steady price action. This indicates growing interest from buyers, potentially setting the stage for a significant breakout.
Key support levels are holding firm, suggesting that bulls are defending these zones effectively. If the volume continues to rise and breaks through key resistance levels, we could see a strong upward trend.

AVAXUSDT 1WAVAX ~ 1W
#AVAX So far it is still maintaining its bullish structure. buy in stages with a minimum target of 20%++

Avax to 100-110 I am adding to swing longs in 41-43 area.
Invalidation clean breaking below 40.
If correct on idea the impulse towards 100 area is coming in next days and very soon.
Timeframe Daily.
Note: Not a Financial Advise.

AVAXUSDT Breaks ResistanceAVAXUSDT Technical analysis update
BINANCE:AVAXUSDT price is breaking the resistance line on the weekly chart with high volume after 1,400 days of ranging movement.
Buy zone: Below $54.00
Stop loss: $40.00
Take Profit 1: $64.50
Take Profit 2: $85.00
Take Profit 3: $140.00
