AVAX/USDT Massive Trend Reversal: Breakout from 8-Month DowntrenAVAX has just delivered one of its most technically significant moves in recent months. After spending over 8 months trapped under a descending resistance line, price action has finally broken free — suggesting a potential trend reversal and the beginning of a much larger bullish phase.
🧠 Pattern & Structure Breakdown:
📌 Descending Trendline Breakout
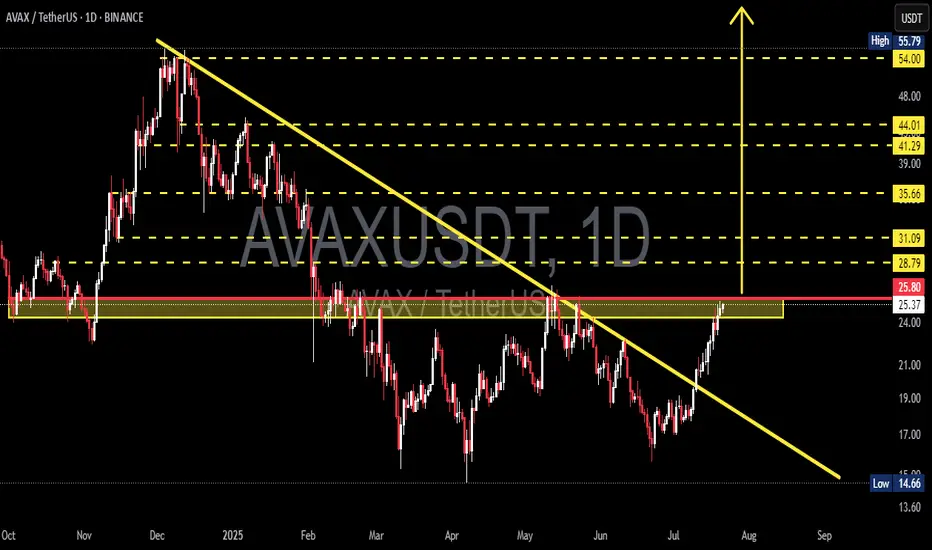
AVAX had been forming a descending triangle pattern, characterized by consistent lower highs and a horizontal support zone between $14.66 – $22. The recent bullish breakout from this structure, accompanied by strong volume, is a highly encouraging sign for bulls.
📌 Accumulation Zone Identified
The yellow zone on the chart ($14.66 – $22) has proven to be a strong demand zone where buyers consistently stepped in. The recent rally originates from this base, indicating possible institutional accumulation.
📌 Critical Horizontal Resistance at $25.80
Price is now testing the $25.80 resistance zone, which historically acted as a supply area. A successful daily close and confirmation above this level would officially flip the structure bullish.
📈 Bullish Scenario – Multi-Level Upside Targets:
If AVAX confirms the breakout above $25.80, these are the key bullish targets ahead:
🎯 Target 1: $28.79 – minor resistance & potential short-term TP zone
🎯 Target 2: $31.09 – previous price equilibrium
🎯 Target 3: $35.66 – key pivot from past market structure
🎯 Target 4: $41.29 and $44.01 – heavy historical supply zones
🎯 Target 5 (measured move): $54.00 to $55.79 – the projected breakout target from the descending triangle pattern
This move would represent a full technical recovery if AVAX aligns with broader market sentiment and Bitcoin remains stable or bullish.
📉 Bearish Scenario – Pullback Risks:
On the flip side, if price fails to sustain above $25.80 and gets rejected:
⚠️ A retest of $24.00 – $22.00 is likely
⚠️ If that zone breaks down, next support lies at $19.00 – $17.00
⚠️ A loss of the $17 level may trigger a return to the critical low near $14.66
This would invalidate the bullish breakout and return AVAX into a sideways or downward consolidation phase.
🔍 Additional Technical Insights:
✅ Volume is steadily increasing — showing renewed buying pressure
✅ Indicators like RSI and MACD (if applied) are likely showing bullish divergence
✅ Overall altcoin sentiment is improving, providing a tailwind for AVAX's potential breakout continuation
🧩 Final Thoughts:
AVAX is at a pivotal moment in its medium-term price structure. The breakout above the long-term downtrend line is a strong technical shift. A confirmed breakout and hold above $25.80 could trigger a multi-week or multi-month rally targeting $40 – $55+.
However, traders should be cautious of possible pullbacks and manage risk accordingly — especially as resistance zones from previous structures are being tested.
#AVAX #AVAXUSDT #CryptoBreakout #TechnicalAnalysis #Altcoins #BullishCrypto #DescendingTriangle #ReversalPattern #AVAXAnalysis
Avaxusdtbuy
AVAX/USDT Weekly Reversal Zone — Major Support Holding
🟨 CRITICAL ZONE (Key Support Area)
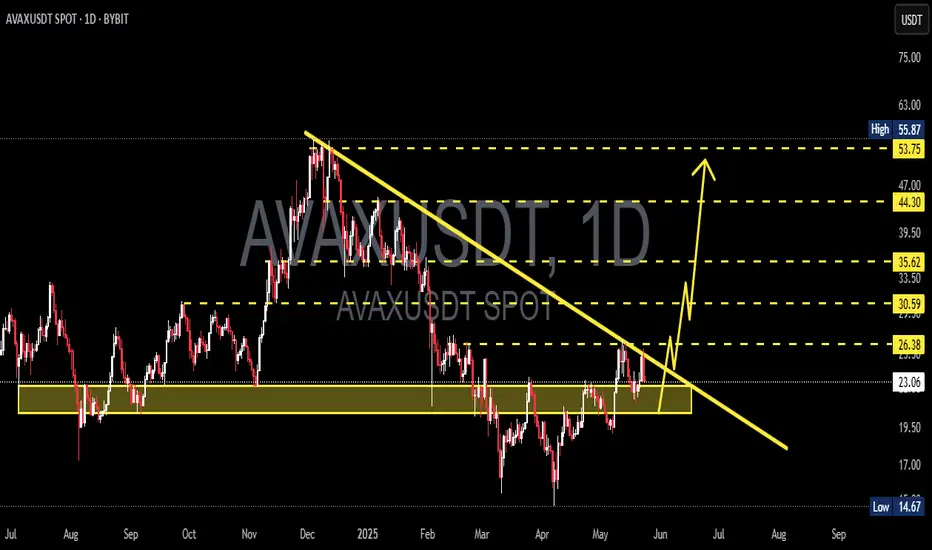
AVAX is currently trading within a major demand zone between $13.5–17.5, a historically strong support area that previously acted as the base for significant upward movements. Multiple weekly candles show rejection from this level, indicating buyer interest.
📊 Pattern Overview:
Double Bottom / Potential Triple Bottom:
The chart illustrates a clear double bottom structure, potentially forming a triple bottom, suggesting accumulation and reversal from the lows.
Bullish Projection Path:
The yellow arrow outlines a projected bullish impulse wave, targeting higher resistance levels if support holds.
📈 Bullish Scenario:
If AVAX maintains support at around $17.1:
1. Price may first test $20.25 (initial resistance).
2. A breakout above $20.25 could open the way to:
$24.98 (strong weekly resistance)
$32.75 (previous distribution zone)
$55.42 (major target/resistance zone)
3. In an extended bullish cycle, price could revisit:
$98.87, $110, and even $128.62 long term (2026+)
A confirmed breakout above $25 with strong volume would further validate the bullish case.
📉 Bearish Scenario:
If the $15–17 support zone breaks down:
1. Price could drop further to:
$11.00 (minor support)
$8.61 (historical low and weekly support)
2. This would indicate strong bearish pressure, potentially leading AVAX into a longer-term accumulation phase.
🔍 Conclusion:
This is a critical decision zone for AVAX. The technical structure shows signs of accumulation and possible trend reversal. However, if support fails, a deeper retracement could occur. Traders should watch this area closely for breakout or breakdown confirmations.
#AVAX #AVAXUSDT #Avalanche #CryptoReversal #TechnicalAnalysis #Altcoins #WeeklyChart #CryptoSupportZone #CryptoBreakout

AVAXUSDT 1W AnalysisAVAX ~ 1W Analysis
#AVAX Buy from here if you still have confidence in this coin with a short term target of at least 20%+, long term target $55

AVAXUSDT 1D AnalysisAVAX ~ 1D Analysis
#AVAX Buy gradually from here if you still have confidence in this coin with a short term target of at least 10%+ from here.
AVAXUSDT 1DAVAX ~ 1D Analysis
#AVAX Buy after successfully penetrating this resistant line with a short -term target of at least 10%+.

#AVAXUSDT: Three Swing Buy Take Profit EntriesThe cryptocurrency market has experienced volatility in recent months, particularly with the #AVAXUSDT token. We have identified two potential price reversal points:
1. **Current Price Range:** The market is currently experiencing a surge in volume, indicating a potential reversal.
2. **Liquidity Removal and Reversal:** If the price were to remove liquidity and subsequently reverse at its previous low, it could trigger a significant price drop.
Additionally, we recommend setting three targets based on your analysis to guide your trading decisions.
We extend our sincere gratitude for your unwavering support since the beginning. We anticipate that this support will continue to grow and evolve.
Team Setupsfx_
🚀❤️

AVAXUSDT 1WAVAX ~ 1W Analysis
#AVAX Buy gradually from here if you still have a Conviction on this coin with a short -term target of at least 20%+.

AVAXUSDT 1WAVAX ~ 1W Analysis
#AVAX Buy gradually from here if you still have a Conviction on this Coin. with a minimum target of 20%+.

AVAXUSDT 1WAVAX ~ 1W
#AVAX So far it is still maintaining its bullish structure. buy in stages with a minimum target of 20%++

AVAXUSDT 1WAVAX ~ 1W
#AVAX If you still have Conviction on the coin,. buy gradually on this support block,. Or you can buy this coin after successfully breaking through this resistance line.
these two scenarios with a minimum target of 20%+

AVAXUSDTAVAX ~ 1W
#AVAX Buy gradually on this support block,. If you still have Conviction on this coin. with a minimum target of 20%+. This is a fundamentally strong layer 1 coin.

#AVAX/USDT#AVAX
The price is moving in a descending channel on the 1-hour frame and is about to break upwards
We have a trend to stabilize above the moving average 100
We have a downtrend on the RSI indicator that supports the rise by breaking it upwards
We have a major support area in green at a price of 17.00
Entry price 19.00
First target 21.22
Second target 23.16
Third target 25.66

AVAX → Avalanche Falls to $22! Heading Back to $50?Since my May 18th update, AVAX has fallen into a pullback, as expected. We found resistance at $41.80, took half profits, and then pulled back in two strong legs. Should we be bearish or bullish on Avalanche?
How do we trade this? 🤔
As expected, AVAX found resistance at the 2021/2022 resistance area of $60.00 after three strong pushes up followed by a head and shoulders reversal pattern. That reversal pattern played out into a two-legged pullback, leaving us near Push #1 support at around $25.00. I think we can expect to continue testing this support area for a while. I do not believe we will break and hold below $25.00.
I would not enter a long yet unless you're fading into your total position size. What we need now is two or three tests of the Push #1 support area between $23.00 and $25.00, forming a double-bottom or reverse head and shoulders pattern. A good strong bull signal candle followed by a confirmation candle is the signal we need to enter a long position, taking half profits at 1:1 Risk/Reward, moving the stop loss up to the entry price, then swinging the latter half of the position to 1:3 Risk/Reward.
We also need to watch Bitcoin's sentiment as the price action plays out. I expect Bitcoin will fall into a two-legged pullback to around $40,000-$45,000, which should take the alt market down with it, either keeping it in a trading range or bringing it to lower lows. Until Bitcoin's sentiment shows a clear bull signal after a likely pullback, it's one more indicator we should allow to play out before getting long in AVAX.
A final point of data is the RSI low and below the moving average of around 42.00, which could remain in this area for some time. This indicates we should be looking for long entries, but should wait for the price action to guide us.
💡 Trade Idea 💡
Long Entry: $27.00
🟥 Stop Loss: $21.33
✅ Take Profit #1: $32.70
✅ Take Profit #2: $44.00
⚖️ Risk/Reward Ratio: 1:3
🔑 Key Takeaways 🔑
1. Three legs up into a resistance zone after a breakout
2. Head and Shoulders reversal pattern
3. Two-legged pullback to Push #1 Support
4. Wait for a double-bottom followed by a strong signal and confirmation candles
5. RSI at 42.00 and below the moving average. Supports waiting for a long entry.
💰 Trading Tip 💰
The longer a trend continues after 3 legs, the probability of that trend continuing lessens. Because of this decreased probability, we ought to reduce our risk when entering trades.
⚠️ Risk Warning! ⚠️
Past performance is not necessarily indicative of future results. You are solely responsible for your trades. Trade at your own risk!
Like 👍 and Follow to learn more about:
1. Reading Price Action
2. Chart Analysis
3. Trade Management
4. Trading Psychology

#AVAXUSD: On the way to 66.00, Buy Swing! Dear Traders,
Hope you are doing great, we have an excellent buying opportunity in form of AVAXUSD which is crypto pair with high potential, we can see price filling the imb zone and reversing from that area. Our main aim here is to wait for price to breakthrough the solid bearish trendline, and then enter when price does confirmation.
Team Setupsfx_

AVAX → Avalanche Falls to $30! Heading Back to $50?AVAX landed just north of our final take profit target of $30 from my last analysis, a perfect drop and profit after three pushes up in a bull trend. Avalanche has been sideways since, are we ready to go back up?
How do we trade this? 🤔
We had three pushes up in a bull trend; the third push made contact with a major 2021 resistance area, followed by two strong bear candles closing on their lows below the Daily 30EMA. We tested the 30EMA as resistance followed by a strong bear bar closing on or near its low on April 9th. That was our confirmation to enter the short down to $27, we took profits just north of $30 where the run ended. This completed a two-legged pullback, which is a signal that the price may want to re-test $50 and beyond.
We've had several attempts to break that low since and found ourselves in a nice trading range. The longer a trading range continues, the greater the chance the price will reverse direction from the price action to the left of the range. With Bitcoin in a nice pullback and seeming to want another run for $74,000, AVAX is likely to follow toward the upside. Wait for a strong bull candle to close on or near its high at this level, then enter a 1:2 Risk/Reward trade, taking half profits at 1:1 R/R ($42.000). Move the stop loss up to the entry price and swing the latter half of the position to $49.00, just before the left resistance area.
💡 Trade Idea 💡
Long Entry: $35.00
🟥 Stop Loss: $28.00
✅ Take Profit #1: $42.00
✅ Take Profit #2: $49.00
⚖️ Risk/Reward Ratio: 1:2
🔑 Key Takeaways 🔑
1. Three pushes up into a bull trend.
2. Price has made contact with a 2021 resistance area.
3. Strong sell signal pushing below the Daily 30EMA
4. Two-legged pullback from bull run, price has run sideways for an extended time, look for long entry.
5. RSI at 40.00 and on the Moving Average, supports long bias.
💰 Trading Tip 💰
It's reasonable to take half profits at the first resistance target in a long trade, or the first support target in a short trade. Using a 1:1 Risk/Reward Ratio for your first target, you can move your stop loss up to your entry price, locking in profits. This allows you to watch the rest of the trade execute without worry of losing money. This helps improve trading psychology and the equity in your account.
⚠️ Risk Warning! ⚠️
Past performance is not necessarily indicative of future results. You are solely responsible for your trades. Trade at your own risk!
Like 👍 and Follow to learn more about:
1. Reading Price Action
2. Chart Analysis
3. Trade Management
4. Trading Psychology


Buy Signal for AVAXUSDTAnalysis:
RSI Bullish Divergence (Yellow): The Relative Strength Index (RSI) is showing a bullish divergence, indicating potential upward momentum.
MACD Bullish Divergence (Light Blue): The Moving Average Convergence Divergence (MACD) is also displaying a bullish divergence, supporting the bullish bias.
Price Approaching Point of Control (POC): The price is nearing the Point of Control (POC), suggesting potential support or a reversal point.
Volume Profile Analysis: Zones with higher volumes in the volume profile have been identified as TP1, TP2, and TP3.
Trade Plan:
Entry: Consider entering a long position as the price approaches the POC or at current levels, given the bullish divergences observed in the RSI and MACD.
Take Profit:
TP1: Set the first take-profit level at the zone of higher volume identified in the volume profile.
TP2: Place the second take-profit level at the next zone of higher volume in the volume profile.
TP3: Target the third take-profit level at the subsequent zone of higher volume.
Stop Loss: Set a stop-loss order below the recent swing low or a suitable support level to manage risk.
Risk Management: Ensure proper risk management by allocating an appropriate portion of your capital to this trade and adjusting position size accordingly.
Note: Always conduct thorough analysis and consider using additional technical indicators or confirmatory signals before executing any trades. Risk management is crucial to protect your capital in volatile markets.

AVAX/USDTTRADE ALERT!AVAX
Ticker: AVAX/USDT
Entry: 35.00-36.00
Take Profit:43.50-45.00
Stop Loss: 31.15
Risk to reward: 1:2
Technical Thesis: Price is going for retest of 4hr 50 EMA at 36$.
Once price hold this level , we can look for long trade here.

AVAXUSDT: 4HR VIEW BINANCE:AVAXUSDT currently in consolidation phase, few candles show some bullish character and we expect a nice clean move from this area. Though, if price decides to remain bearish then it can fall further down where there is imbalance which price will likely to fill before it touches the 55.00 region.
What do you think about this pair, do you think it will create a new record?

AVAXUSDT at daily support and likely to bounceThe price is trading at daily support DS1. Very close to it is daily support DS2. The price may bounce from here from DS1 or may also go to DS2 and bounce from there. However, a long is favorable from DS1/DS2 towards daily resistance DR1 around 13.5 area.

🟢 AVAX - 4H (24.07.2023)🟢 AVAX - 4H
My EP 1 limit long for AVAX has triggered at 13.480 . Looks like a bull flag formation.
Full setup as follows:
EP 1 - 13.480
EP 2 - 13.110
SL - 12.800
TP 1 - 14.260
TP 2 - 14.640
TP 3 - 15.00

AVAXUSDT at 4h support, likely to head towards 14The price the weekly resistance WR1 and got rejected from there. This rejection led the price to hit 4h support 4HS1. This support seems to be good one for a bounce and attempt to the weekly resistance again. Therefore, a long seems to be favorable from this level to price zone around 14. However, in case this support is lost, the daily support DS1 is another level where the price will find the support and a bounce will be favorable for the long trade towards the zone where currently 4h support 4HS1 lies.

Avax | Getting Ready For Breakout Avax has been trading in the same area for a long time, this time I think it can breakout with high volume ,in case of breakout, Avax will grab the upper side liq.expecting 50-80% bullish Move
Remember: We only give ldea's from our
experience and knowledge, it does not
mean that it will be 100% correct, the
market is always unpredictable, anything
can happen anytime.
Always trade with your own research and
knowledge. If You Are Satisfied With Our
Work Then Join.
