long trem Avaxit has a long-term dynamic support, if this support is broken, iwill enter the pullback, and if it grows and stabilizes above this support, iwill enter...
Avaxusdtlong

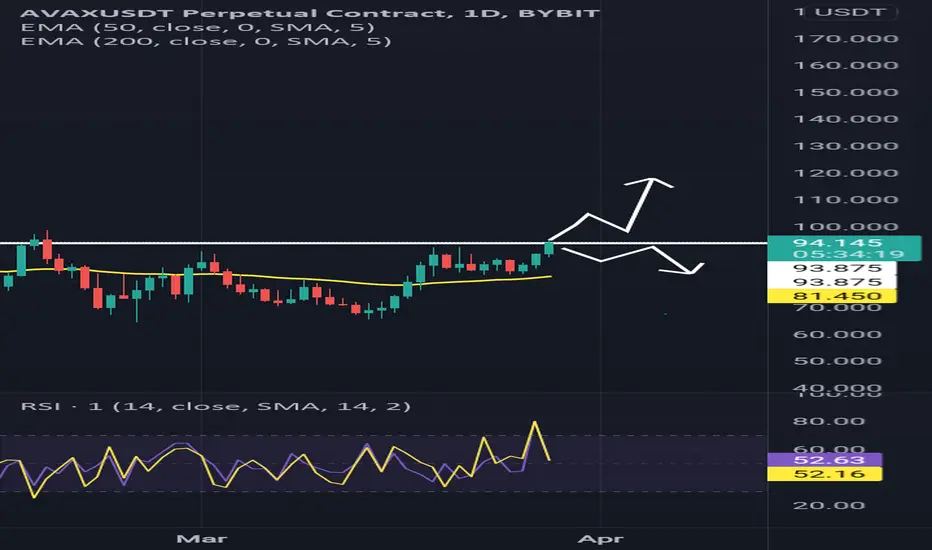
$AVAX 1D lines to watchlove these levels
hit 64.529 since last posts' breakdown
LTFs/EMAs ww
execute accordingly

⭕️BUY Crypto AVAXUSDT ; at the best place 🧐⭕️You see the analysis of the cryptocurrency used in the avalanche blockchain network (AVAX) in four hours(AVAX USDT , H4)🔎
🔰As the analysis shows, the best place to buy low risk is at the intersection of the uptrend line (white) and the support line (orange)❗️
The profit and loss limits are specified in the image👌
⚠️⚠️Please observe capital management and open a low volume transaction❗️❗️
I hope this analysis is useful for you🙏🏻🌹
📌Please introduce the "TRADER STREET" to your friends 🙏🏻
_______________________📈TRADER STREET📉________________________

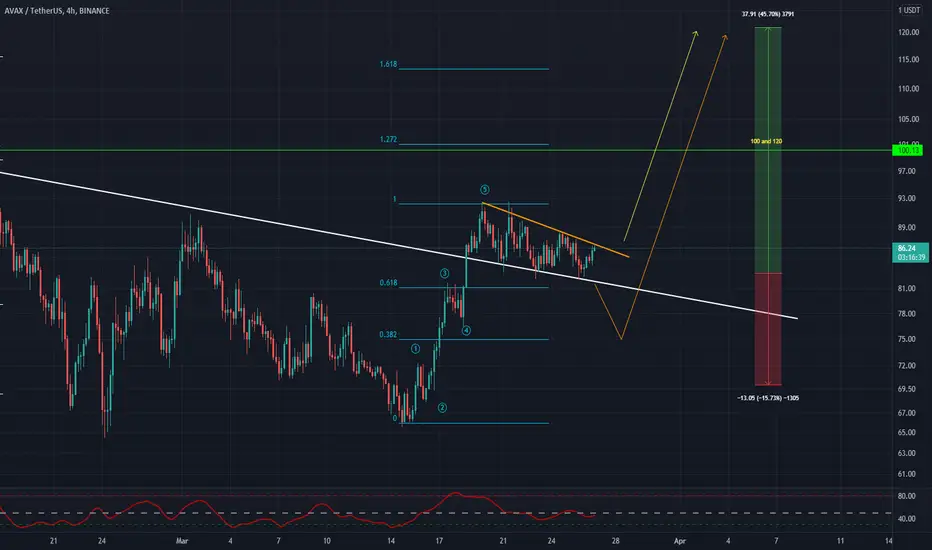
AVAXUSDT Analysis (LOCAL VISION)Hello friends.
Please support my work by clicking the LIKE button👍(If you liked). Also i will appreciate for ur activity. Thank you!
Everything on the chart.
Entry: market and lower
Target: 100 and 120
after first target reached move ur stop to breakeven
Stop: 69 (depending of ur risk). ALWAYS follow ur RM .
Risk/Reward: 1 to 3
risk is justified
Good luck everyone!
Follow me on TRADINGView, if you don't want to miss my next analysis or signals.
It's not financial advice.
Dont Forget, always make your own research before to trade my ideas!
Open to any questions and suggestions.
AVAXAVAX approaching a key level for a bullish continuation
Wait for confirmation at the POI for entry.
Trade safe.
NB: Patience + Risk management = Winning trades
#E2kclciks #Avax

LONG AVAX📍SIGNAL ID: #024📍
COIN AVAX/USDT ( 10x )
DATE : 8 April 2022
Positions : BUY / LONG 💹
➖➖➖➖➖➖➖
Entry < $89.2
SL $80
TP max $99

LONG AVAXLONG SIGNAL
AVAXUSDT
Entry $84.5
TP 1 $89.00
TP 2 $90.50
SL : 81.00
AVAX is ON major support that is can be bounce anytime.

AVAX/USDT : How to trade AVAX BINANCE:AVAXUSDT
Hello everyone 😃
Before we start to discuss, I would be glad if you share your opinion on this post's comment section and hit the like button if you enjoyed it !
Currently it's not a good idea to swing trade $AVAX.
- Day-Traders and Scalpers can have their taste on the lower time-frames...
I'll be looking for the positions on both side if we get the confirmation on them !
- I'll take my Long once $AVAX reaches above $105 and aiming for $117 - $130
- I'll take my Short once $AVAX reached below the trendline ( Better to be below $88 ) and aiming for $77 - $67
🔴 Be aware of $BTC's movement; I'm still looking for the rejection on $51K's level.
Hope you enjoyed the content I created, You can support us with your likes and comments !
Attention: this isn't financial advice we are just trying to help people on their own vision.
Have a good day!
@Helical_Trades

AVAX USDT ANALYSISAvax is performing well as other altcoins do. We broke the bearish TL, and now we can go even higher to $115. Just watch volume and sentiment on other altcoins.

Avax fighting resistance Avax is at resistance, a strong resistance which has failed to break it several times, if avax breaks this resistance , we can enjoy some green dildoooos!
DON'T TRADE AT RESISTANCE, YOU WILL GET REKT
AVAX formed a topless P - LONGTopless P is a sign of bullish momentum. First TP is $98. Will update you soon.

Don't miss opportunity for long position AVAXUSDThello every one
all you need to know is in the chart
look closely and make your position smartly
this is just my idea and not a financial advice
just for pro and not a buy and sell signal

AVAX BUYBuying Avax again for the second time today.
Buying right here.
My stop loss and targets are on the chart.

avax will growbuy AVAX. Due to the fact that it has hit the Moving 200, it can grow to the specified levels.

AVAX Looks BullishOn the left (USD pair) shows a falling wedge where price has broken out of, this breakout should continue bullishly
The BTC pair on the right also looks bullish, having established a heavy support along the 1.618 Fibonacci circle line

AVAXUSDT It is possible to climbIf the price stabilizes above 100, the ascent speed will probably increase, I considered the price of 75 as a loss limit, but this is related to your trade, good luck
*This is just an analysis, Trade with risk management


AVAX/USDT Bulls are crossing the support line and try to make a new bullish rally, if its cross the mentioned resistance line then Tp1 and Tp2 will be 98 and 110 respectively.
#AVAXUDT #AVAX #USDT #buycall

AVAXUSDT Next target!AVAXUSDT (1D Chart) Technical analysis
AVAXUSDT (4h Chart) Currently trading at $79
Buy level: Above $80
Stop loss: Below $60
Target 1: $94
Target 2: $119
Target 3: $144
Target 4: $180
Max Leverage 2x / Spot Market
Always keep Stop loss
Follow Our Tradingview Account for More Technical Analysis Updates, | Like, Share and Comment Your thoughts

AVAX/USDT BUY SETUP 50-100% POTENTIALAVAX Descending triangle Pattern
MACD Showing bullish crossover
Potential upward movement from here🚀
Target mentioned in the chart
Green line for long term target
The NEXT $LUNA Do't miss it!
Stoploss : $76.5

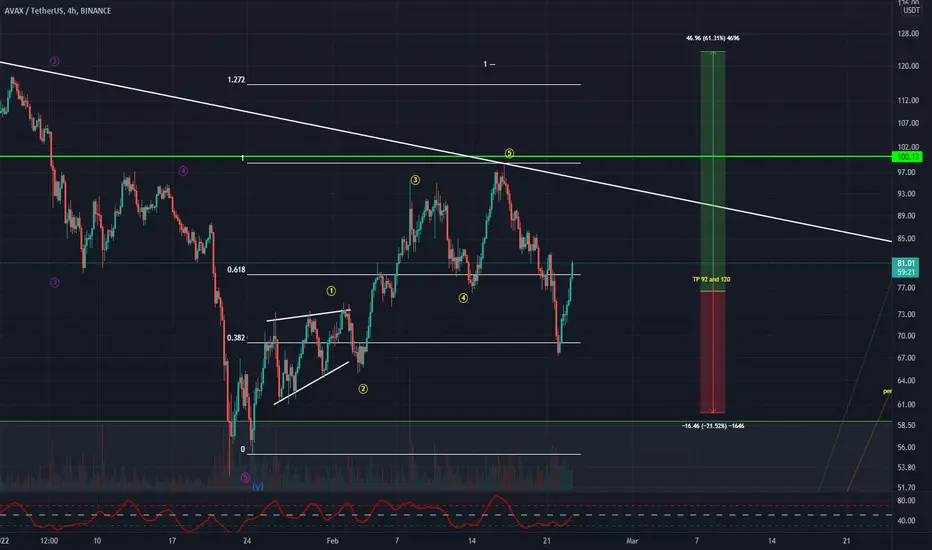
AVAXUSDT Analysis (LOCAL VISION)Hello friends.
Please support my work by clicking the LIKE button👍(If you liked). Also i will appreciate for ur activity. Thank you!
Everything on the chart.
Nothing has changed from my last idea.
Entry: market and lower (im in pos from 64)
Target: 92 and 120
Stop: ~59 (depending of ur risk). ALWAYS follow ur RM .
after first target reached move ur stop to breakeven
Risk/Reward: 1 to 3
risk is justified
Good luck everyone!
Follow me on TRADINGView, if you don't want to miss my next analysis or signals.
It's not financial advice.
Dont Forget, always make your own research before to trade my ideas!
Open to any questions and suggestions.
Buying #AVAX/USDT Here ( SWING ) Outlook bullish pennant pattern
Shape double bottom on trendline pennant, stochastic on oversold zone
Expecting rejection going to resistance pennant trendline
Target mentioned in the chart
Stop loss : $70
Risk : 5%
