AVAXUSDT Descending Channel Breakout!AVAXUSDT Technical Analysis Update
AVAXUSDT formed a descending channel pattern, and the price has already broken through the channel resistance with high volume. We can expect a good upward move in AVAX.
Buy zone : Below $16.90
Stop loss : $14.85
Always Keep Stop LOss
Thanks
Hexa
Avaxusdtlong

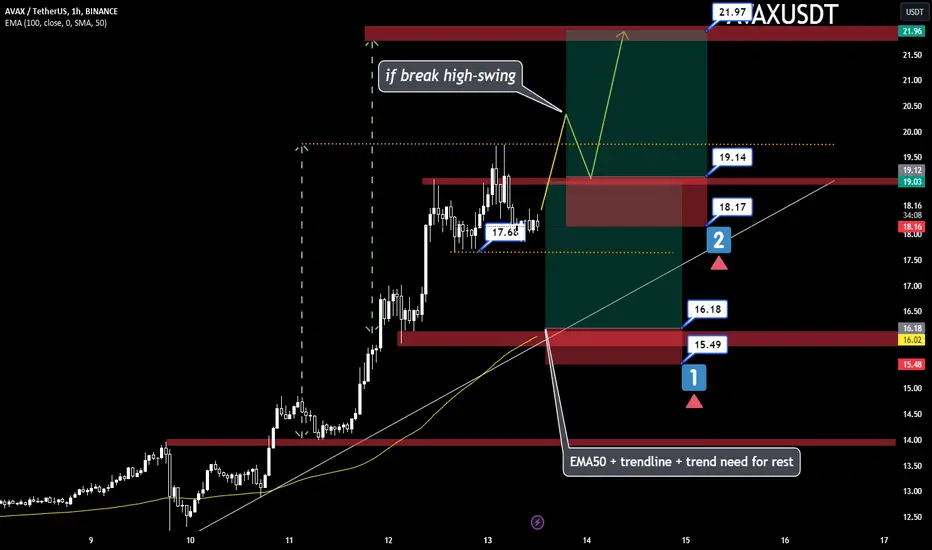
AVAX- ENTRY BY PRICEACTION 📈1-entry :EMA50 + trendline + trend need for rest
2-entry:if break high-swing
📊 (Buy) :
1EN: 16.18$
2EN: 19.14$
🔴 Stop Loss :
1EN: 15.49$
2EN: 18.17$
🎯 Take Profit :
1EN: 19$
2EN: 22$
📡 For more communication with us, send a message in TradingView.

AVAX Rockets to New Heights! Get Ready to Ride the Bullish Wave
I witnessed Avalanche (AVAX) make a stunning 15% pump, propelling it towards its next resistance level of 0.34. Brace yourself, my friend, because AVAX is about to take off like never before!
AVAX has been on a remarkable journey lately, defying expectations and gaining significant momentum. The recent 15% surge has brought it tantalizingly close to breaking through the 0.34 resistance level, marking a potential turning point for this incredible cryptocurrency. This is not just a random spike, but rather a clear indication of the bullish wave that is building up behind AVAX.
Now, you might be wondering, "How can I ride this wave and make the most of this opportunity?" Well, my friend, it's time to consider taking a long position on AVAX. By going long, you can potentially capitalize on its upward trajectory and reap the rewards of its anticipated surge. The market sentiment is overwhelmingly positive, and AVAX's technical indicators are aligning perfectly to support this exciting rally.
Here's your call-to-action: Don't miss out on this golden opportunity to maximize your gains! Seize the moment and consider opening a long position on AVAX today. Take advantage of the current bullish sentiment and position yourself for potential profits as AVAX confidently smashes through the 0.34 resistance level.
Remember, timing is crucial in the crypto market, and AVAX's journey is just getting started. By taking a long position now, you position yourself ahead of the curve, ready to ride the wave as AVAX surges to new heights.
So, my friend, buckle up and join the AVAX revolution! Let's ride this bullish wave together and make the most of this exciting opportunity. Your potential for profit awaits!
Should you have any questions or need assistance in executing your trade, feel free to reach out by commenting below. I'm here to help you navigate this thrilling journey and ensure you make the most informed decisions.
Wishing you an exhilarating and prosperous trading experience!

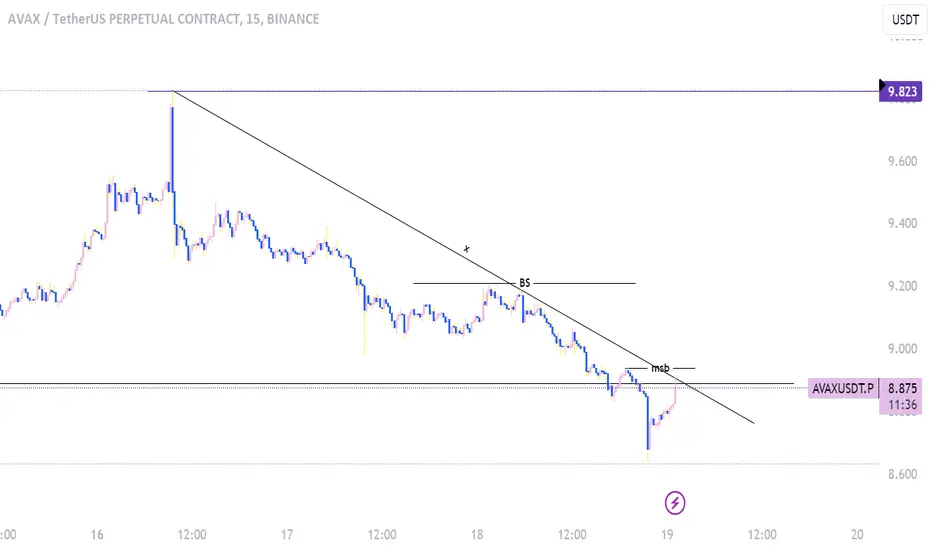
AVAX trendline breakout incoming ??Hello Traders i hope you are doing well
Avaxusdt facing a strong trendline resistance and rejected multiple time
once we breakout from here we have some fvgs OB which is not metigated yet so its possible we go back to 9.9-10$
cheers to all
Avax trade LongHello traders i hope you are doing well
AVAX making bullish divrgence here and once we have some volume and strength its possible we will go up
as you can see whenever price made bullish divergence it took liquidity to the upside
we have Pending FVG and OB which is not metigated yet
Long 9
tp 10.5

AVAXUSDT Elliott Waves AnalysisHello friends.
Please support my work by clicking the LIKE button👍(If you liked). Also i will appreciate for ur activity. Thank you!
Everything on the chart.
Entry zone: 8 - 6.5$
Targets: 12 - 16 - 22
after first target reached move ur stop to breakeven
Stop: (depending of ur risk). ALWAYS follow ur RM .
risk is justified
Good luck everyone!
Follow me on TRADINGView, if you don't want to miss my next analysis or signals.
It's not financial advice.
Dont Forget, always make your own research before to trade my ideas!
Open to any questions and suggestions

AVAX/USDT downward momentum? 👀 Avax Today Analysis It appears to be on the brink of a captivating shift, showing signs of waning momentum and a potential downward trajectory.👀
💎 After its initial touch on the OB, AVAX experienced a robust rejection. However, the subsequent 2nd and 3rd touches seemed less forceful. What's the implication? It suggests a depletion of liquidity, hinting at a possible move to address the Bullish Order Block, leaning towards a downward continuation.
💎 Alternatively, there's a chance that the price might bounce back from the previous order block, setting its course upwards.
💎 In the dynamic world of crypto, staying informed and adaptable is key. Stay tuned for more updates and enjoy your trading journey

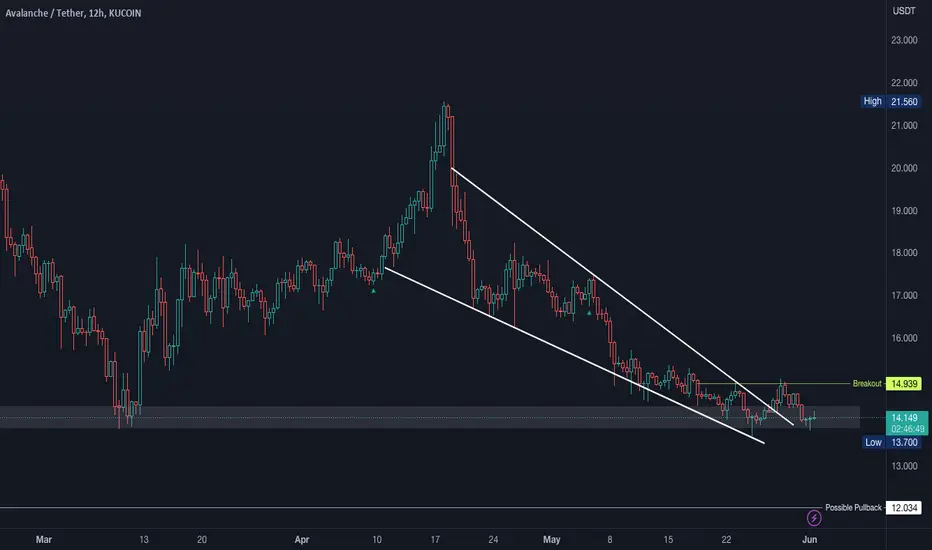
We Are Near at Low of a Bullish ChannelI think is Good Chance To Complete Buying Of Avax In This Area If Red Triangle Breaks Toward Up

AVAXUSDT at daily support and likely to bounceThe price is trading at daily support DS1. Very close to it is daily support DS2. The price may bounce from here from DS1 or may also go to DS2 and bounce from there. However, a long is favorable from DS1/DS2 towards daily resistance DR1 around 13.5 area.

🟢 AVAX - 4H (24.07.2023)🟢 AVAX - 4H
My EP 1 limit long for AVAX has triggered at 13.480 . Looks like a bull flag formation.
Full setup as follows:
EP 1 - 13.480
EP 2 - 13.110
SL - 12.800
TP 1 - 14.260
TP 2 - 14.640
TP 3 - 15.00

AVAXUSDT at 4h support, likely to head towards 14The price the weekly resistance WR1 and got rejected from there. This rejection led the price to hit 4h support 4HS1. This support seems to be good one for a bounce and attempt to the weekly resistance again. Therefore, a long seems to be favorable from this level to price zone around 14. However, in case this support is lost, the daily support DS1 is another level where the price will find the support and a bounce will be favorable for the long trade towards the zone where currently 4h support 4HS1 lies.

AVAX/USDT bullish Scenario 🚀🔥Avax today analysis💎 AVAX is primed for an upward trajectory, as indicated by the RSI trading above 50, signaling positive momentum.
💎 Currently, it's retesting the demand zone and appears poised for an upward move. We've previously observed the demand zone transforming into a supply zone following market uncertainty.
💎 Above, there's a supply zone and a bearish order block that warrant attention.
💎In the dynamic world of crypto, staying informed and adaptable is key. Stay tuned for more updates and enjoy your trading journey

AVAXUSDTAgain, I think AVAX hasn't finished its 5-star downtrend, so I'm waiting for it to arrive
Remember the $4 price tag
The descending triangle pattern should be completed and then the price will go up
Just a theory

AVAX Falling Wedge!BINANCE:AVAXUSDT is sitting in an aggressive wedge with prices being squeezed.
I've got this post as a long as the price action leans towards that direction.
Price is at previous area of value and with bullish divergence.
> Waiting for buying pressure.
Remember, this BINANCE:AVAXUSDT chart even though is sitting in a possible bullish wedge will be
dragged around by BINANCE:BTCUSDT so you must have plan A / plan B scenarios planned for.
You can refer to my CRYPTOCAP:BTC idea here: tinyurl.com
On a possible fake out of this level, this will provide bullish ideas in line with the falling wedge.
So the Bulls really need to hold this level (zone) to avoid further downside.
Bearish ideas could have potential targets to 12.03 levels.
Always having Plan A and Plan B scenarios so we can react once the markets provide an opportunity to execute our edge.
If you liked this idea or if you have your own opinion about it, write in the comments.
The information and publications are not meant to be, and do not constitute, financial, investment, trading, or other types of advice or recommendations.
AVAXUSDT Elliott Waves AnalysisHello friends.
Please support my work by clicking the LIKE button👍(If you liked). Also i will appreciate for ur activity. Thank you!
Everything on the chart. (update)
Entry: market and lower
Target: 20 - 25 and maybe 28-33 zone
after first target reached move ur stop to breakeven
Stop: (depending of ur risk). ALWAYS follow ur RM.
Risk/Reward: 1 to 5
risk is justified
Good luck everyone!
Follow me on TRADINGView, if you don't want to miss my next analysis or signals.
It's not financial advice.
Dont Forget, always make your own research before to trade my ideas!
Open to any questions and suggestions.

avaxusdt are you rdy ?🧨😉Avax currency
First, I must say that there should be a downward trend until the target of $10.79. The short trend for this currency is up to this target.
The upward trend for this currency has two attractive targets and the entry is $10.79, then the targets it will see will be $21.34 and the doom target will be $30.49.
All analyzes are done with the knowledge of banking transactions.

AVAX looks INTERESTING!KUCOIN:AVAXUSDT
AVAX is approaching an interesting level for a possible long providing a potential of about 40% upside gains.
However, since Bitcoin is sitting in a huge Head & Shoulders pattern, we must let our edge develop on lower time frames 4h to
look at entry triggers.
Should the Head & Shoulders activate, potential downside target to possible pullback zone is an idea.
Future markets open in about 3h 20m
Always having Plan A and Plan B scenarios so we can react once the markets provide an opportunity to execute our edge.
If you liked this idea or if you have your own opinion about it, write in the comments.
The information and publications are not meant to be, and do not constitute, financial, investment, trading, or other types of advice or recommendations.

Avalanche AVAX to 19.99$ ?👑 #AVAX/USDT BUY 👑
Entry:
14.60✅
Targets:
1️⃣15.89🎯
2️⃣16.96🎯
3️⃣17.84🎯
4️⃣18.73🎯
5️⃣19.99🎯

Hi, I see A very good Swing trade opportunityHi,
I see A very good Swing trade opportunity
Risk to reward is very convenient
Good luck Every one

Trade Idea💸 #AVAX💸
📊 5min
This analysis will be updated.
🟢BUY Level: 14.55$-14.45$
❌Stoploss: 14.390$
🎯TP1: 14.60$ ☑️
🎯TP2: 14.65$ ☑️
🎯TP3: 14.70$ ☑️
🎯TP4: 14.75$ ☑️
➖➖➖➖➖➖➖➖
📊Analysis Method⤵️
🔸Smart Money Concept
🔸Volume Profile
🔸Neural Network
🔸Echo
🔸Liquidity Swings + Order Blocks
➖➖➖➖➖➖➖➖
👤 Analysis by Jack-of-all-trades
📅 5.20.2023

AVAX BULLISH IDEA (DOUBLE BOTTOM)Potential Bullish Entry Dow Theory In Place -
Higher High and Higher Low Expected in Place
Formation of double bottom coupled with bullish divergence (Bullish reversal pattern)
Entry, SL & TP Levels are defined.

W10-35 AVAX BULLISH IDEAPotential Bullish Entry Dow Theory In Place -
Higher High and Higher Low Expected in Place
Formation of double bottom coupled with bullish divergence (Bullish reversal pattern)
Entry, SL & TP Levels are defined.
