AVAX (Follower Request)Somebody just asked my thoughts about Avaxusdt.
I Just don't trade this one at all so this is not any trade idea.
I am just sharing my thoughts and idea about what could happen and what could be the ideal scenario in this one.
I think this one can claim 50 Area and Deviate back to range.
Boosts and follows helps me to motivate for new Ideas.
Thanks.
Note: This is not a trade idea.
Note: Not a Financial Advice.
AVAXUSDTPERP

Avax Target - Good short entryAVAX analysis - Elliott Wave Perspective
After an impulsive uptrend, Avax seems to be losing momentum and consolidating. Now that it has reached its highest points, it may be time for a wave of downward movement.
According to the Elliott Wave perspective, AVAX is currently in the final wave of an impulse wave. This means that we will soon see a correction, but there will still be one last upward move. I am personally taking a short position between $28.00 and $28.50 for the following reasons:
- 1 to 1 extension of wave 1
- 1.618 extension (expanded flat)
- Bearish divergence (RSI)
- Correlation Main count BTCUSD (Related ideas)
It is important to note that the Elliott Wave perspective is based on historical price movements and patterns, and future price action can never be predicted with absolute certainty. Markets can be volatile and unpredictable, so it is always wise to trade cautiously and manage your risks.
Remember, financial markets are inherently volatile, and investing is always a personal choice. It is crucial to conduct thorough research, carefully assess your risk tolerance, and form your own judgment before making any trading decisions.

Bull-channel (AVAX)❤️❤️Thanks for boosting 🚀 and supporting us!
📈we are in bull-channel so our position on buy and high channel level for next target.
📊 (Buy) : 22
🔴 Stop Loss : 21.11
🎯 Take Profit : 22.77 - 23.66 - 24.33
🔗 For more communication with us, send a message in TradingView.
👨🎓 Experience and Education: Our trading team has five years of experience in financial markets, especially cryptocurrencies.

AVAXUSDT Descending Channel Breakout!AVAXUSDT Technical Analysis Update
AVAXUSDT formed a descending channel pattern, and the price has already broken through the channel resistance with high volume. We can expect a good upward move in AVAX.
Buy zone : Below $16.90
Stop loss : $14.85
Always Keep Stop LOss
Thanks
Hexa

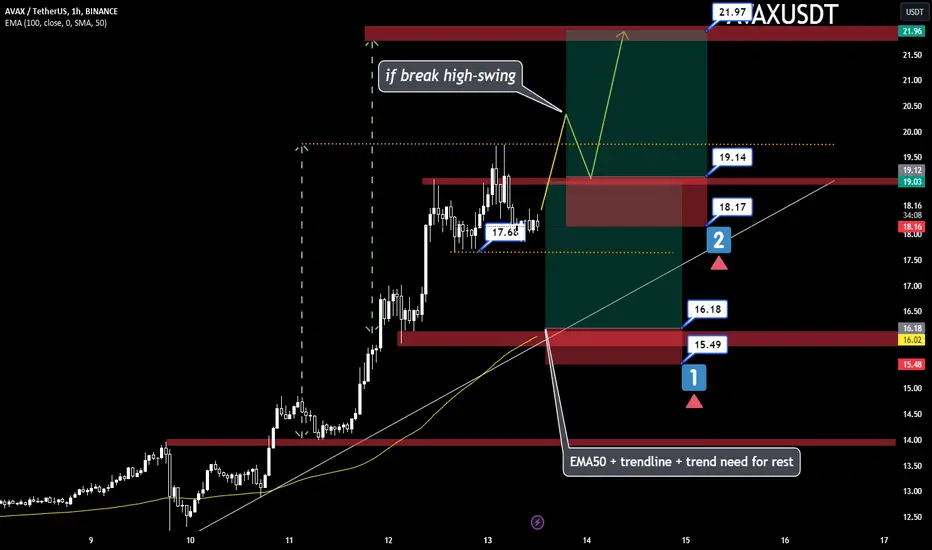
AVAX- ENTRY BY PRICEACTION 📈1-entry :EMA50 + trendline + trend need for rest
2-entry:if break high-swing
📊 (Buy) :
1EN: 16.18$
2EN: 19.14$
🔴 Stop Loss :
1EN: 15.49$
2EN: 18.17$
🎯 Take Profit :
1EN: 19$
2EN: 22$
📡 For more communication with us, send a message in TradingView.
AVAX Rockets to New Heights! Get Ready to Ride the Bullish Wave
I witnessed Avalanche (AVAX) make a stunning 15% pump, propelling it towards its next resistance level of 0.34. Brace yourself, my friend, because AVAX is about to take off like never before!
AVAX has been on a remarkable journey lately, defying expectations and gaining significant momentum. The recent 15% surge has brought it tantalizingly close to breaking through the 0.34 resistance level, marking a potential turning point for this incredible cryptocurrency. This is not just a random spike, but rather a clear indication of the bullish wave that is building up behind AVAX.
Now, you might be wondering, "How can I ride this wave and make the most of this opportunity?" Well, my friend, it's time to consider taking a long position on AVAX. By going long, you can potentially capitalize on its upward trajectory and reap the rewards of its anticipated surge. The market sentiment is overwhelmingly positive, and AVAX's technical indicators are aligning perfectly to support this exciting rally.
Here's your call-to-action: Don't miss out on this golden opportunity to maximize your gains! Seize the moment and consider opening a long position on AVAX today. Take advantage of the current bullish sentiment and position yourself for potential profits as AVAX confidently smashes through the 0.34 resistance level.
Remember, timing is crucial in the crypto market, and AVAX's journey is just getting started. By taking a long position now, you position yourself ahead of the curve, ready to ride the wave as AVAX surges to new heights.
So, my friend, buckle up and join the AVAX revolution! Let's ride this bullish wave together and make the most of this exciting opportunity. Your potential for profit awaits!
Should you have any questions or need assistance in executing your trade, feel free to reach out by commenting below. I'm here to help you navigate this thrilling journey and ensure you make the most informed decisions.
Wishing you an exhilarating and prosperous trading experience!

AVAX trendline breakout incoming ??Hello Traders i hope you are doing well
Avaxusdt facing a strong trendline resistance and rejected multiple time
once we breakout from here we have some fvgs OB which is not metigated yet so its possible we go back to 9.9-10$
cheers to all
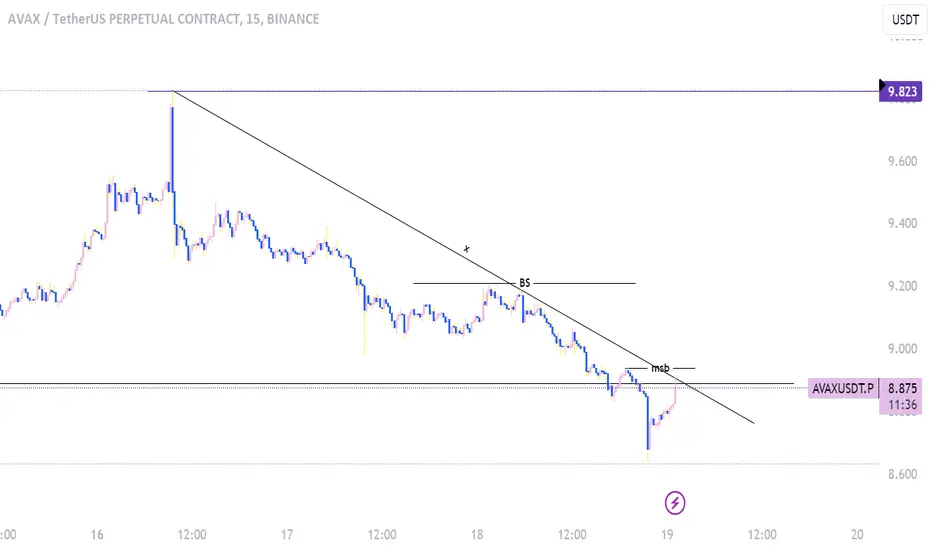
Box section : 8.81-10.09Hello?
Hello traders!
If you "Follow" us, you can always get new information quickly.
Please also click “Boost”.
Have a good day.
-------------------------------------
(AVAXUSDT chart)
The key is whether the price can be maintained by rising above 13.4704.
Therefore, from a long-term perspective, 13.4704 or lower can be considered the bottom range.
(1W chart)
The key is whether it can receive support and rise around 9.76.
At this time, what is important is whether the price can be maintained by rising above the MS-Signal indicator.
(1D chart)
You are looking at the 1M chart and the 1W chart, but you may be asking, is there a need to see the entire chart on the 1D chart?
The reason to view the 1D chart as a full chart is to see how support and resistance points are marked.
You can check support and resistance points through the 1W chart and 1M chart, but since they only show approximate points, it may be burdensome to use them in your trading strategy.
The only support and resistance point formed across the entire chart is the 7.72 point on the current chart.
Therefore, other support and resistance points can be said to be support and resistance points that are still being formed.
Therefore, this means that the role of support and resistance may be weak.
Therefore, AVAX can also be seen as a coin (token) that is likely to show a large upward trend whenever a full-fledged upward trend begins.
No matter how likely it is that there will be a big uptrend at any time, if the trading volume does not increase accordingly, it may be meaningless and should not be given much meaning.
The recent move caused the HA-High indicator to drop and create a new one.
Accordingly, the HA-Low indicator and the HA-High indicator are showing close proximity.
Accordingly, if it shows support in the 8.92-9.83 range, it seems likely that it will turn into an upward trend.
If we select the box section with this in mind, it falls within the 8.81-10.09 section.
Therefore, when the StochRSI indicator leaves the oversold range, the key is whether it shows movement out of the 8.81-10.09 range.
-------------------------------------------------- -------------------------------------------
** All explanations are for reference only and do not guarantee profit or loss in investment.
** Trading volume is displayed as a candle body based on 10EMA.
How to display (in order from darkest to darkest)
More than 3 times the trading volume of 10EMA > 2.5 times > 2.0 times > 1.25 times > Trading volume below 10EMA
** Even if you know other people’s know-how, it takes a considerable amount of time to make it your own.
** This chart was created using my know-how.
---------------------------------

Avax trade LongHello traders i hope you are doing well
AVAX making bullish divrgence here and once we have some volume and strength its possible we will go up
as you can see whenever price made bullish divergence it took liquidity to the upside
we have Pending FVG and OB which is not metigated yet
Long 9
tp 10.5

Divergence 2hr on AvaxDivergence occurs when price makes higher highs, while indicators paint lower lows or vice versa. Simply put, divergence is when price direction contradicts indicator direction, creating a noticeable conflicting pattern.
A bullish divergence occurs when the RSI displays an oversold reading followed by a higher low that appears with lower lows in the price. This may indicate rising bullish momentum, and a break above oversold territory could be used to trigger a new long position.The bearish is opposite to it

AVAX descending Trianglehey traders i hope you are doing well
AVAX is making descending triangle and if it breakdown side the target is marked
8.7xxx
and if we break towards upside the target will be 9.85
you can open long or short after breakout

AVAX .P perfomance in last 8 months in 2023This year has been a rough year for crypto. Downward pressure appears with all coins.
With the AVAX 1h frame, we see the price continuously entering the red area (possibly signaling a downtrend).
This is test result from the beginning of 2023 to the present including the current bearish period. Let's see how the S1-TM performs in a downtrend.
If you have any idea or wanna see results with Spot AVAXUSDT, please leave a comment.

AVAXUSDT at daily support and likely to bounceThe price is trading at daily support DS1. Very close to it is daily support DS2. The price may bounce from here from DS1 or may also go to DS2 and bounce from there. However, a long is favorable from DS1/DS2 towards daily resistance DR1 around 13.5 area.

🟢 AVAX - 4H (24.07.2023)🟢 AVAX - 4H
My EP 1 limit long for AVAX has triggered at 13.480 . Looks like a bull flag formation.
Full setup as follows:
EP 1 - 13.480
EP 2 - 13.110
SL - 12.800
TP 1 - 14.260
TP 2 - 14.640
TP 3 - 15.00

AVAX price prepares for an upward impulse, as far as it can go?Now the AVAXUSDT price is in consolidation under a strong mirror level. Buyers are likely gaining the strength to up break out. Looking at the chart on a large timeframe, we can say that this is a difficult task.
So, at the moment, we are making notes for ourselves on a rather modest potential growth in the price of Avalanche token (by the standards of the crypto market)
The first target is $13.90 +8%.
The second target is $14.80 + 15%.
In the price range of $13.90-14.80, sales of those who bought AVAX long a few months earlier, but the growth did not work out, and the deposit was in drawdown, may increase. Usually, in such situations, the human brain thinks: "I can at least sell my coins at "break-even" and it will be good.
If the Avalanche project is interesting to you, write about it in the comments, and then we will try to update our thoughts on possible price movements of AVAXUSD more often.
_____________________
Did you like our analysis? Leave a comment, like, and follow to get more

AVAXUSDT at 4h support, likely to head towards 14The price the weekly resistance WR1 and got rejected from there. This rejection led the price to hit 4h support 4HS1. This support seems to be good one for a bounce and attempt to the weekly resistance again. Therefore, a long seems to be favorable from this level to price zone around 14. However, in case this support is lost, the daily support DS1 is another level where the price will find the support and a bounce will be favorable for the long trade towards the zone where currently 4h support 4HS1 lies.

Avalanche to tumble southward as the downtrend persistsThe daily and 4-hour price charts of Avalanche showed the bears were highly likely to drive prices lower, especially after the move below $13.88 on 5 June.
The higher timeframe charts showed that the mid-April rally failed to break key highs.
This was followed by a downtrend in May, but the $13.8 area posed some opposition to the sellers.
Avalanche had a bearish bias on the price charts. It is the fifth largest blockchain in terms of TVL but its DeFi activity stagnated in recent months. In other news, SushiSwap announced the launch of their v3 suite of products on Avalanche.
The price action presented short sellers with an opportunity. The structure was bearish, but the volatility has been high over the past 48 hours despite seller dominance. If the prices fall beneath $13.5, it would represent a continuation of the downtrend.
The market structure was bearish on the daily timeframe, and a downtrend was in progress. The 4-hour chart also showed a downtrend in progress. In May, the price formed a series of lower highs and lower lows.
The $13.88 level served as support, but AVAX still formed a low at $13.71 on 25 May. On 5 June, the price fell to $13.48, showing that bears remained dominant. Despite the bounce to $14.6 on 7 June, the market structure remained bearish.
Monday’s move was used to plot a set of Fibonacci retracement levels (pale yellow). It showed the 78.6% retracement level at $14.62, which explained the inability of the bulls to drive prices higher. Having established the bearish character of the market, a short trade can be entered upon a retest of the 50% retracement level at $14.21.
The 23.6% and 61.8% Fibonacci extension levels at $13.14 and $12.58 can be used to book profits. A move by AVAX above $14.93 would invalidate this idea as it represents a key short-term lower high.
It has been noted that the prices bounced to the $14.62 level on Wednesday. Despite that, the spot CVD continued to decline. Over the past 24 hours, the metric was flat, this showed buyers were in the minority and selling pressure was overwhelming.
The Open Interest picked up a little, amounting to close to $10 million. However, when AVAX faced rejection at $14.6, the open interest dropped further. This development hinted at discouraged bulls. Overall, the bearish sentiment was prevalent both on the low and high timeframes.

Avalanche AVAX to 19.99$ ?👑 #AVAX/USDT BUY 👑
Entry:
14.60✅
Targets:
1️⃣15.89🎯
2️⃣16.96🎯
3️⃣17.84🎯
4️⃣18.73🎯
5️⃣19.99🎯

Avalanche AVAX price preparing for a new wave of growth ?It is very likely that the AVAXUSDT price is now completing a correctional wave (2)
Critical support below which the AVAX price should not fall is $13.90-16
If this is the case, then the Avalanche token holders will face a (3) growth wave ahead.
The targets for growth in this wave are currently "smeared" at 37-50$
If this asset is interesting to you, then be active in the comments, we will see them and make more ideas for AVAXUSD as the price grows
_____________________
Did you like our analysis? Leave a comment, like, and follow to get more

AAVAXUSDTR.P ELLIOT WAVE-2 COMPLETED WAVE=-3 STARTEDhello firends today i share aavax chart analysis elliot wave - 1 & wave- 2 cycle completed.
wave - 3 now sstarted and now near suipport zone so it is very profitable trade entry, Tareget and stoploss below the ressistance or using ATR
chart pattren and wave analysis are both shown in the uptrend started today or tomoorrow
get ready folks,
thanks

AVAXUSDT SHORTLower break found , using less risk-taking long profit, scenario might change any time, Doller index is correcting nad dominance is also rejected, expect a pull back in crypto

Avax | Getting Ready For Breakout Avax has been trading in the same area for a long time, this time I think it can breakout with high volume ,in case of breakout, Avax will grab the upper side liq.expecting 50-80% bullish Move
Remember: We only give ldea's from our
experience and knowledge, it does not
mean that it will be 100% correct, the
market is always unpredictable, anything
can happen anytime.
Always trade with your own research and
knowledge. If You Are Satisfied With Our
Work Then Join.

Avax going south?I'm trying and testing a new strategy, if you have any comments and ideas here don't take me too seriously, it's not a financial recommendation and I can definitely be 99% wrong =D
