(BTC) bitcoin price - orange lineThe orange line has not over taken any shoulder of the price for BTC so for now it appears as though the price is holding, gaining, but not losing.
Averages
bitcoin going upthis is an advance code for tradingview that would tell someone when they sold buy or sell bitcoin based on moving averages, volume and open interest

EURUSD H4 StrategyAfter a large decline last week, there is a greater chance of a rebound this week, but there is still resistance above 1.0780-1.0840. Recommended operation for this week: buy low, sell high strategy. But the operation of buying low can be more active.
Strategy:
Buy Zone (positive) @ 1.0640 - 1.0710
SL: 15-25
TP: 40-80
Sell Zone @ 1.0780 - 1.0840
SL: 15-25
TP: 30-60

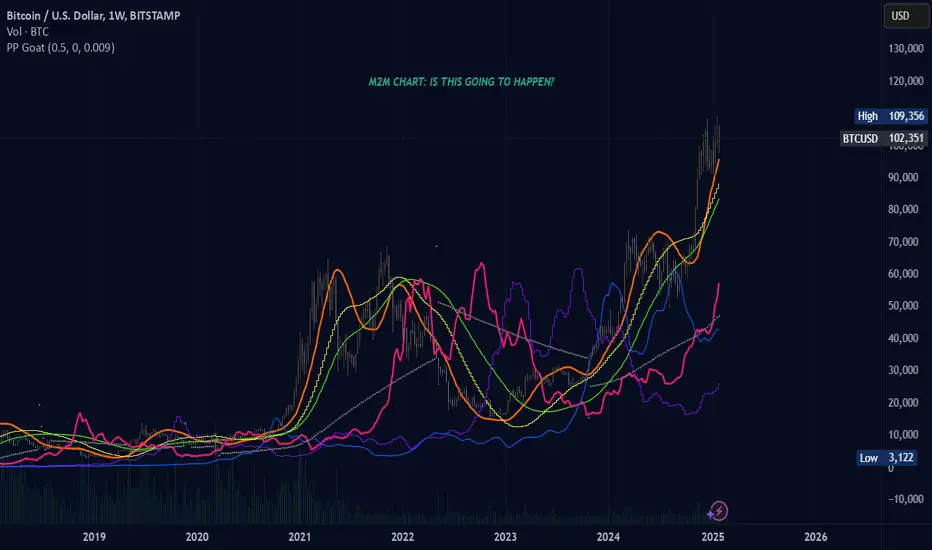
(BTC) bitcoinHere is a perspective that is different than a long view that is always optimistic. A lot of the time due to so much optimism in cryptocurrency for BTC to determine when the price will actually decrease is a lot more difficult. From what I can see in the image the pink dot line appears to reveal a pattern where when the line is flat certain factors in cryptocurrency occur. Whether or not those factors are necessarily happening now is really up to the viewer of the chart. This is a combination of moving averages and adding a sixth line which is a combined average of averages with a time period of 150 the sum of all the smaller lines. The chart is with vwma.

GOLD Short 2nd of May 2024Price was below the 200MA which is RED
MACD cross above the 0 line
Short term moving averages are RED
Entry on the close of the hour candle with SL at the previous high and TP at the lows.
Currently running in the region on 190 but pushed to near 300 pips.

AVAX Kimbo Meme coin could of bottom out from hereLooking at the charts and volumes it done it's 3rd leg wave down in volumes (OBV chart at the bottom) and $0.0003992 US price could of been the next bottom for these waves. If so, Kimbo poised to be big for AVAX meme coin
The OBV volumes showing less selling presure now and good chance in the days ahead great buying pressure
Some of the fundamentals:
Avalanche Foundation Snaps Up KIMBO, COQ, and Three Other Tokens as First Meme Coin Investment
www.coindesk.com
I when to dexscreener to evaluate what moving fast for meme coins - dexscreener.com - Clicked on LIQUIDTY and when sort by descending order, Kimbo is number 2 spot. The number 1 spot doesn't have much value but Kimbo has long term potential for big gains
Their website is IMPRESSIVE!! So much community work on this meme coin A++ www.kimboavax.com
This the big one - they actually "burning" the "token supply" so Kimbo becomes more scarce. What think going to happen with the prices when reduce the token supply? Prices go up and up and faster!
If scroll down the bottom of the page for Kimbo website you see "Kimbo Merchandise" - These meme coins have VALUE! and can buy NFTs for it too
Fundamentals is good, AVAX team buying into this meme coin for exchange liquidity. Most likly be listed on KuCoin and then Binance. This has pretty good volumes too and I like the charts for this great opportunity
On twitter they going to expose this project to the masses on Facebook, Instragram i believe very soon. It has 18,000 twitter followers and can go pass the 50 to 100,000 followers
twitter.com
This poised to be the next Shib Inu, Dodge meme coin where billon and billon of dollars flood through this project
Do you like Kimbo, do you think it has so much potential?

Polycab Touching 50 SMA Support Anyone who want do take positions for 1..2 weeks in Polycab can do so now.
Join the Learning Community of TrendX Institute 😊📈🚀 8800611235

A Novice's Handbook to Trading Triumph
-----
🙏
In an era where financial landscapes evolve rapidly, venturing into the dynamic domain of foreign exchange (Forex) trading need not be an intricate odyssey. This novella of wisdom unveils the rudiments, steering you through the intricate labyrinth of setting up your financial fortress, handpicking the tools of the trade, deciphering the enigmatic timelines, and sculpting entry strategies with the finesse of an artisan.
Navigating the Terrain of Account Setup:
Your journey commences by selecting the sturdy vessels of financial exploration, the likes of Coinbase, revered for transmuting mundane currency into the futuristic realms of cryptocurrency. Navigate the seas of connectivity, tethering your accounts to the steadfast anchors of Visa, Mastercard, or the versatile iDeal. Venture further into the undiscovered territories with a seasoned guide – Tradersway, an oracle in the realm of brokers, beckoning with bespoke options for an authentic trading saga.
Sculpting the Trading Landscape: Platforms and Tools as Your Artistic Palette
Forge your path with MetaTrader 4 (MT4), the canvas for your live trading masterpiece. Unveil the ethereal allure of a Virtual Private Server (VPS), akin to a mythical power-up, enriching your automated trading endeavors. Wander into the meadows of TradingView, where user-friendly charts bloom, and ideas spring forth from a convivial community of traders. Consider wielding the nNouSign indicator, a magical wand for crafting diverse trading strategies.
Chronicles of Time: Timeframes for Poetic Analysis
For decisions swift as the flutter of a butterfly's wing, gaze upon the 5-minute (5M) and 15-minute (15M) charts, where markets pirouette in perpetual rhythm. Should your ambitions soar higher, ascend to the 1-hour (1H) chart, where profit potential unfurls like a tapestry woven with the threads of time.
Crafting Entry Strategies: The Artistry of Navigating Waves
In the realm of 5M and 15M, embrace the mystique of the nNouSign indicator on TradingView, intertwining with the 21 Linear Weighted Moving Averages (MA) on the sacred grounds of MT4. Enlist the Williams Percent Range (WPR) at 40, a beacon illuminating shifts and retests. Draw lines, as an artist sketches contours, on both your chart and the WPR canvas for heightened insights. Decipher the harmonies between MA and WPR, directing the symphony of buying and selling. Set the crescendo with Take Profit (TP) at favored peaks or where echoes of prices linger in the corridors of time.
The sonnet of 1H unfolds with kindred strategies, casting TP anchors where your heart desires or where the echoes of prosperity resonate. Anticipate the ballet of trends, choreographed by the highs/lows of yesteryears or the harmonious convergence of MA and WPR.
Risk Management: Navigating the Seas of Uncertainty
As the helmsman of your financial vessel, chart the waters of risk with sagacity. Know the depths you are willing to plunge for the elusive treasures of profit. Let stop-loss orders be the vigilant guardians against tempests, strategically placed to avert colossal losses. For instance, on a £300 expedition trading XAUUSD with a 1:500 leverage, let the StopLoss, a guardian set at 200 pips, stand steadfast at 1987.00 for a buy trade anchored at 1989.00. As you navigate, survey the constellations of currency pairs—those that pirouette in unison and those that waltz in opposing directions.
Educational Alchemy: The Chronicles of Wisdom
Embark on an odyssey through the scrolls of easily decipherable Forex education platforms. Join the symposiums of Forex communities, where sages share their sagas and novices glean the pearls of insight. Chronicle your journey, the trials, and the triumphs in the scrolls of a journal, an atlas mapping the uncharted territories of your evolving knowledge.
Epilogue: 🌹
In the grand tapestry of Forex trading, the loom is not as daunting as it may seem. Armed with the artisan's tools, weave your narrative, learning with every stroke of the quill. Navigate the seas of risk with the astuteness of a seasoned mariner, adjusting your course with each gust of the trading winds. In the realm of Forex, the adventure unfolds not as a tumultuous tempest but as a voyage guided by the stars of knowledge. Bon voyage, intrepid trader! May your odyssey be as prosperous as the markets are ever-changing.
-----
❣️

How We Use The Forecast Model PatternsThe current position of all patterns (with the exception of the Cumulus Triangles) are not set in stone. The patterns can extend across many different price and time ranges at any given point in time. The current positions are default locations determined by analyzing the historical average position were each pattern occurred across all cycles. We currently have every pattern in this default position to help us gauge where the Bitcoin price most likely will be in the future, and to compare historical price behavior to the current situation.
Thanks for watching!

The Fall of the Titans: Crypto Downtrend Unfolding on the 4hAre we witnessing the Fall of the Titans? Is crypto, the digital currency titan that has been dominating the financial landscape for over a decade now, showing signs of slowing down? The recent data on the 4h chart reveals an unfolding story - a Crypto Downtrend that may have significant implications for investors and enthusiasts alike.
In this modern era of finance, cryptocurrencies have morphed from being an underground secret of the tech world into an open powerhouse that shapes financial markets globally. However, they have not been without their share of unpredictability and turbulence. The recent activity on the 4h chart, particularly, paints a picture of a potential shift in momentum - a Crypto Downtrend.
Understanding The 4h Chart
Before we delve into the specificities, it's crucial to understand what a 4h chart signifies. The 4h chart, as the name implies, represents price movements over 4-hour periods. Traders often use this intermediate timeframe to discern the medium-term trends in the crypto market, which allows them to plan their strategies accordingly. The 4h chart gives a more comprehensive view of market dynamics as compared to the shorter timeframes, without getting drowned in the long-term noise of the daily or weekly charts.
Indicators of a Crypto Downtrend
In crypto trading, several indicators suggest a potential downtrend. Key among them are lower highs and lower lows, which hint at a declining price momentum. Other indicators such as the moving averages, the Relative Strength Index (RSI), and the MACD can further support these observations.
In the current scenario, the 4h chart shows a pattern of lower highs and lower lows, which is a tell-tale sign of a Crypto Downtrend. Additionally, the moving averages have seen a bearish crossover, while the RSI is hovering in the lower regions. These all point to a potential reversal of the bullish trend we've been experiencing.
Impact of the Crypto Downtrend
This potential Crypto Downtrend has significant implications. For one, it indicates a period of price correction, where the overvalued prices return to more realistic levels. While this could be a cause of worry for some investors, it could present an opportunity for others.
For investors who have been waiting on the sidelines, this could be their chance to get in, to buy the dip. On the contrary, those who are heavily invested might want to brace themselves for potential losses, or consider hedging their investments.
The Way Forward
While the current observations from the 4h chart do point towards a Crypto Downtrend, it is essential to remember that the world of cryptocurrencies is known for its volatility. In the world of crypto, trends can reverse quickly and unexpectedly. Therefore, investors and traders should always stay vigilant and responsive to the changing market dynamics.
Also, it's important to note that a downtrend isn't necessarily a bad thing. In fact, it can serve as a healthy correction in an otherwise overheated market, paving the way for sustainable growth in the long run.
So, is this the fall of the digital titans, or merely a small bump in the road? Only time will tell. For now, though, it’s a good time to stay alert, plan your strategies, and tread with caution in the fascinating world of crypto.
---------------------------
This article is for informational purposes only and does not constitute financial advice. Always do your research and consult with a professional before making any investment decisions. Crypto trading involves risk and is not suitable for all investors.

YUMC daily bearish hammerYUMC daily bearish hammer at local high with nice volume. Stop loss above local highs, take profit to MA 200.

QQQ weekly indecision after bearish hammerOrder SELL QQQ NASDAQ.NMS Stop 264.34 LMT 264.34 will be automatically canceled at 20230401 01:00:00 EST
QQQ weekly indecision after bearish hammer. If we don't reverse next week we'll go lower. Stop loss above both candles, take profit into buying zone.

CHK daily bullish hammer CHK daily bullish hammer at MA 100 retest gap and good volume. Stop loss below MA 100, take profit at next resistance. Gotta be short since countertrend and earning are ahead of us.

HLT daily bearish hammer local high with volumeHLT daily bearish hammer local high with volume. Stop loss above local highs, take profit at MA 200.

Keeping It SimpleThere's so much going on right now, but I think this chart sums it up for assets in general. This is a fairly simple idea I fantasized a while ago and it played out to my surprise. Every once and a while, the percentage of bullish stocks doubles, and then a selloff happens. Unless we can break this symmetry and make a clear break above 25, we should not expect anything special. It's easy to fomo in but possibly the best move is to move to other markets.
Also note the severity of the 2020 dump, before being launched by money supply expansion, among others:
We did not yet meet the level of the 2020 crash. Also, there is no money supply expansion this time. So, what would have happened in 2020 or perhaps 2008, should really happen this time, unless of course there is more money supply expansion.
Cheers and don't forget to hedge your bets!

GOLD 💥 detachment spotted 👀There is a detachment on EMA5! At weekly chart... this can make gold to move up!
Let's wait and observe, so we can find the best way to enter today...
Better to wait and have a good entry, then to get stuck at this tiny range...
It's been boring, but profitable!
Dont forget that
Patience is key!

Short opportunity on SHIB1000A short opportunity is forming on 1000SHIBUSDT on perpetual futures at Binance. You can see all the same signals in the chart above this month. I will detail each one below.
Rules for the entries
LONG
price closing above MA 200 (yellow) and MA 20 (red)
The last candle is going above the open value of the latest bearish candle
Last bearish candle can be at max three candles away from the latest candle
The last candle must be close to the MA 20 (red)
SHORT
price closing below MA 200 (yellow) and MA 20 (red)
The last candle is going below the open value of the latest bullish candle
Last bullish candle can be at max three candles away from the latest candle
The last candle must be close to the MA 20 (red)
Stop Loss
The lowest value of the latest four candles when Longing. The highest value of the latest 4 candles when Shorting
Take Profit
Two times the size of the stop loss.
May/2022 Signals
Signal #1 - May 1st - 8h timeframe
After a dogi candle, it's a 50% chance that the price goes either direction. We stick to the rules and go short. This signal gave close to 6,8%
Signal #2 - May 5th - 8h timeframe
After a slight bearish movement, the price engulfed the bullish candle. We entered at the open price of that candle, shorting again. Profit was 13.5%
Signal #3 - May 10th - 8h timeframe
After a bullish candle with a big upper wick, we saw a good rejection of the past candles. So we follow the rules for another short, reaching more than 20% profit.
Signal #4 - May 13th - 8h timeframe
Again, after two consecutive bullish candles with some upper wicks, we got almost a bearish engulfing candle. After that, it triggers our short order. The trade is still open this time, so we may add more or close it to book some profits and prepare for the next trade.
Signal #5 - May 17th - 8h timeframe
Our latest signal is almost valid. However, the price may go below the latest bullish candle open value, and we may expect a 13% profit. This signal will invalidate if the price reverses and exceeds our predetermined stop loss.
Total profit this month so far is around 45,3% with 1x leverage.

Do you see what I see?The scale is from 0-300. Combines the Russell 2000, Nasdaq, and S&P percentage of stocks above the 200 day MA.
Looks like the market should take caution if you take into account the trend of inflection points...
Good luck and hedge your bets!

ULTIMATE MACD GUIDE - ENTRY'S AND EXITS 📚The Moving Average Convergence Divergence Oscillator , otherwise known as MACD, is one of the most powerful and dynamic indicators, if you can learn to use it properly.
It is easily one of my personal favorite indicators, and one that I currently use when scalping and day trading.
Now before we get into how the MACD works on a technical level, let’s first go over how the MACD helps us fundamentally.
We can break it’s benefits down into 4 categories - in which it allows us to measure and predict the following:
The strength of a pattern
The momentum of a movement
The direction of a movement
The duration of a movement
Let’s breakdown each of those
-The Strength Of A Pattern-
Have you ever seen price approach the outer limits of a wedge, channel, or support / resistance and wondered, cluelessly whether or not it would actually break through or end up rejecting?
The MACD allows us to predict the pressure behind a certain sentiment, and therefore predict the odds of that pattern completing successfully. (possible example)
-The Momentum Of A Movement-
When trading, especially day trading, it is important to have almost impeccable timing for entries and exits. The MACD allows us to see and predict current and future momentum. This is powerful, as it allows us to enter a long before the rest of the market has gone long (essentially entering a long before the market pumps.)
This increases our profit/loss ratio - therefore decreasing risk and allowing for more sturdy stop losses.
-The Direction Of A Movement-
This one is quite obvious when looking at the MACD, but without the indicator, it can sometimes be quite difficult to even see which way the market is trending (periods of high consolidation for instance)
By utilizing the MACD on multiple time frames, we can have a glimpse of where the market is headed, even if it is unknown on the smaller time frames. (the opposite is also true, when the higher time frames are in periods of high consolidation, we can take a look at the lower time frames to get an idea of where it is heading)
-The Duration Of A Movement-
As mentioned previously, it is extremely important as a day trader to have very accurate entries and exits. Ironically, one of the most difficult things for a novice trader to predict is an accurate exit.
if you exit too early, you miss out on valuable profits and further decrease your profit to loss ratio. Yet, if you exit too late, you also lose valuable profits and decrease your P&L ratio. How do you find that sweet spot, to maximize your profits?
The MACD allows us to use past history to predict the duration of the current trend, and exit when it is most necessary.
-How To Apply The MACD And Gain Its Benefits-
Now that we have gone over exactly what the MACD offers, it is time to learn how to use it.
the MACD consists of 4 components:
The signal line (slow line)
The “MACD” line (fast line)
The baseline
The histogram (a visual, often color coded representation of both lines interacting)
These four components interact with each other in a very dynamic way, and allows for very versatile, wave-like movement (one of the only of its kind.) This is incredibly useful, as the market itself works in a very similar wave-like pattern of thrusts and rest, thrusts and rest and so on. there aren’t many other indicators (if any) that display the markets ebb and flow quite like the MACD. Let's break down what each aspect does.
-The Signal Line-
The signal line or ‘slow line’ is calculated based on the 26-period ema. This is the standard numerical value for the MACD, but can typically be adjusted in it’s settings to your preference. The signal line is the basis for whether a trend is overbought/ oversold and whether the momentum is bullish/ bearish.
-The MACD Line (fast line)-
The MACD line is calculated based on the 12-period ema. When the MACD line crosses above the signal line, this is considered the very beginning of a bullish movement. Why is this the case? Well, if the average price of the past 12 candles is moving higher than the average price of the past 26 candles, we can assume that in the short term, the momentum is bullish.
The opposite is also true. when the MACD line is below the signal line, this is the very beginning of a bearish movement.
-The Baseline-
The baseline is considered the very center of the MACD indicator. It is the line where the red and green bars of the histogram meet and where the scale on the right hand side reads zero. The purpose of the baseline is to further indicate the distance between the signal and MACD line.
the higher above the baseline the MACD and signal line go, the further the distance is between the two (meaning the 12-period ema is much higher than the 26-period ema.) This is useful in showing how overbought or oversold the equity is in that particular time frame.
The opposite is also true. the lower below the baseline these lines move, the further apart they are. However, in this case, the 12-ema is much lower than the 26-period ema. This indicates that the price may be oversold.
-The Histogram-
The histogram is the bread and butter of this entire indicator. As you become more familiar, the signal and MACD line will be very helpful in seeing the nuances of a movement and the market as a whole. As a beginner though, the histogram is your best friend. it takes all of the information mentioned previously, and compacts neatly into a color coded, numerical value system.
Each bar of the histogram corresponds to the above candle. This is useful as it allows us to predict future histogram bars, and where the MACD may be headed in the future.
Whenever the MACD line crosses above the signal, the histogram turns green. whenever the MACD line crosses below the signal, the histogram turns red. As the MACD approaches the signal line, the histogram weakens, and the bars grow smaller and smaller - closer and closer to the baseline. However, as the MACD line separates from the signal, the histogram bars grow larger and larger, further from the baseline.
-The Culmination-
All of this information can be combined, to assess the MACD on multiple time frames and make an educated decision on market direction.
A trading plan using the MACD could look something like this (using SPY):
-Before the market opens, check hourly MACD. wait until the hourly looks oversold, and the histogram appears to have peaked. (once the newest histogram bar is shorter than the previous, this marks the peak)
-Once peaked, this indicates that momentum for the next several hours should return to the baseline (spy is oversold)
-Now, you could go to lower time frames such as the 5 and 15 minute, keeping in mind that the hourly is oversold, so buying pressure should be at its heaviest now.
-Use the MACD on the lower time frames to judge the smaller thrust and rest periods, buy at the rests and sell at the thrusts.
Don't even get me started on how I view a chart as a collection of emotions, and how I believe the MACD displays these emotions better than any other indicator can (we'll save that for a separate post.) The MACD and its strategies/ nuances could be talked about for hours, but I hope this helped. I'll likely be doing another post, outlining more concrete examples of how to use it, so stay tuned!

FaceBook (Meta) Downtrend continuesOn daily chart, dead cross (50 sma crossing below 200 sma) is about to happen. Fib Level 0.618 - $332 (the rectangle area) is a huge resistance which has been tried 4 times in December. Also 200 and 50 smas is suppressing the bullish movement. Looking for a breakdown to $300 area in near future.
Disclaimer: This is not a trading advice. I am not a financial advisor. Only for fun and educational purposes. I won't accept any responsibility if my idea fails.

$SQ 15min Chart Trend Analysis Moving AveragesWell above 200 SMA : Was able to close above a resistance. Nice opportunity to get in at EOD.
Study combines 5, 10 EMA + 20, 50, 200 SMA + Ripster Clouds

November 3, 2021 GBPJPY 4 HOUR 50 MAI have been leaning towards a MA retest strategy that has been panning out pretty well these past few months.
Here is a setup from a trade last week. I primarily look for candles closing at the 4 hour closes and also around the 1 hour closes around the NY session open.
There are three MA's I use. The 20 MA (blue), 50 MA (red) and the 200 MA (gold). Not only does the candle have to close on the 20 or 50 MA but the moving averages must be lined up.
I use the 4 screen layout. The daily chart on the top left, 4 hour on the top right, 1 hour on the bottom left, and 15 min on the bottom right.
A) IF Price closes on the 4 hour 20 MA, I need price to also close on the 50 MA on the 1 hour, and the 200 MA on the 15 min. This is my Moving Average Correlation Strategy.
B) IF Price closes on the 4 hour 50 MA, I need price to also close on the 200 MA on the 1 hour.
C) IF Price closes on the 1 hour 20 MA, I need price to close on the 15 min 50 MA, and 5 min 200 MA.
D) IF Price closes on the 1 hour 50 MA, I need price to close on the 15 min 200 MA.
These are the primary correlations I use to trade. I also check the daily, but I find more setups with the above for IF, THEN criteria. Remember, the moving averages must be ALSO positioned correctly.
From here, I wait for a candle stick confirmation. I will either get in an engulfing candle on the 50 MA or the 200 MA.
TRADE ABOVE:
In the above chart, the 50 MA is above the 20 MA and price is in a downtrend. < This is how we would expect these 2 MAs to be positioned. I would not look for a short IF the 20 MA is above the 50 MA. Next is the Moving Average Correlation between timeframes.
When price closed at the 50 MA on the 4 hour, price ALSO closed on the 1 hour 200 MA matching scenario (B).
I traded this at the next 4 hour close showing an engulfing candle. 10 times out of 10 a RR of 4 typically hits, I close at Daily Resistance and Daily Support levels.
Does anyone else trade this way? Is this your first time seeing this? Please respond so I know I"m not the only one here. Looking for all of your feedback!
@MDFX_TRADES

Get Ready To Accumulate More SHIBSHIB is currently by far one of my favourite coins. I don't have that much, but it's a good amount to be happy.
Anyways, let's take a look on the MACD and STOCHRSI. The Daily and Weekly do not have enough valid Data Points to give us any hints where we are and where we are going, but what we have on the 4h is a strong indication that we might head down to the deep to the 0.786 FIBB Area. This is where SHIB might bottom out and take us to the next moon levels. and where I'm going to set a huge buy order. Moving Averages are looking quite alright, but EMAs need to recover and turn into a bullish bias. I do not expect to see SHIB getting rugged in any kinda way, since this project is very popular now among Dogecoin Fans and Dog fans in general.
