AVGO Long IdeaTechnological stock NASDAQ:AVGO goes down and this is opportunity for LONG position.
The analysis based on Bollinger Bands (21,2) and RSI (30,70). We can see at 258$ the BB breakout when the RSI indicate to wait for more drop down.
Together with support trend line it's yield a strong buy at 254$.
Two scenarios are possible, the stock still goes down below 254$ , then RSI ALGO (8,65,35) will indicate the time to buy, otherwise the stock will start go up immediately to 278.02$ . This idea should not be considered a buy or sell recommendation.
AVGO

AVGO Elliot Wave TheoryAVGO. I am bearish on AVGO. To confirm it, it needs to stay below the red trendline (resistance) and breaking down below the green trendline (support), targets are 210, 202. If the red trendline is broken out, bear play is invalidated.

AVGO - WEEK CHART Hi, today we are going to talk about Broadcom and its current landscape.
Broadcom is poised to receive increasing attention from the market as relevant events are taking place. The company's exposure to the 5G and progress on the sector raises Broadcom's potential valuation, despite the company has unveiled a timid forecast for 2020.
Thank you for reading and leave your comments if you like.
To have access to our exclusive contents, join the Traders Heaven today! Link Below.
Disclaimer: All content of Golden Dragon has only educational and informational purposes, and never should be used or take it as financial advice.

AVGO - DAILY CHARTHi, today we are going to talk about the Broadcom Inc and its current landscape.
Huawei and its suppliers received exciting news, as the U.S. Commerce Department renewed a 90-day period extension, that grants to American companies’ permission to continue to do business with the giant Chinese telecom companies. Commerce Secretary Wilbur Ross's announcement included that the need for extension was also due to the necessity of some rural communities of the Huawei 3G and 4G networks. The extension should keep the supplying chain going, principally of the Americans ones like Broadcom Inc that have its revenues highly exposed to Huawei demand (6% of its revenue, represent by ¥2.09 billons) and have now another quarter of relief from the tension of loose a so significant company like Huawei. The concerning aspect it’s if this extension doesn't lift the results of its supplier on the next quarter, considering that the Chinese company might already be restructuring its supply chain, as the uncertainty created by the ongoing Trade War that ended blacklisting the company on the U.S. The Huawei CEO Ren Zhengfei also already have been clearly vocal that isn't concerned with the U.S decisions and said that Huawei could grow without the U.S markets.
Thank you for reading and leave your comments if you like.
To have access to our exclusive contents, join the Traders Heaven today! Link Below.
Disclaimer: All content of Golden Dragon has only educational and informational purposes, and never should be used or take it as financial advice.

Cybersecurity ETF - Huge volume spike Technical Analysis:
CIBR had a volume spike of 850,000+; which is 80% higher than usual, yesterday November 12th 2019.
The 50sma (yellow line) is bouncing back, trying to cross the 200sma (red line), and after it must cross 100sma (blue line) for it to continue being bullish.
10sma is short-term support - $29.3
All time highs is short-term resistance - $30.7
CIBR top holdings:
VMW - 6.64%
PANW - 6.63%
AVGO - 6.15%
CSCO - 6.03%
OKTA - 5.12%
FEYE - 3.50%
FFIV - 3.32%
SPLK - 3.18%
JNPR - 3.18%

AVGO - DAILY CHART Hi, today we are going to talk about AVGO
We observe a D1, some important points. The details are highlighted above.
Thank you for reading and leave your comments if you like.
Join the Traders Heaven today, for more exclusive contents!
Link bellow!
Disclaimer: All content of Golden Dragon has only educational and informational purposes, and never should use it as financial advice

AVGO Forms an Asymmetrical Triangle Ahead of Earnings SeasonAVGO is slowly working to complete the Asymmetrical Triangle candlestick pattern that started in June.

Meeting with tech executives on Huawei ban at White House - NewsReported by Reuters
White House economic adviser Larry Kudlow will host a meeting with semiconductor and software executives on Monday to discuss the U.S. ban on sales to China's Huawei Technologies Co Ltd , two sources briefed on the meeting said on Friday (July 20th).
Treasury Secretary Steven Mnuchin will also attend the White House event, to which chipmakers Intel Corp and Qualcomm Inc have been invited, the people said.
The subject of Huawei was expected "to come up but that it is not the reason why they are convening the meeting," said the official, who spoke on condition of anonymity.
The future of U.S. companies' ties to Huawei, the world's no. 1 maker of telecommunications equipment, remains uncertain after the Trump administration put the company on a blacklist in May, citing national security concerns.
One of the people briefed on Monday's meeting said Broadcom Inc was also invited to the White House event. Microsoft Corp was also expected to receive an invitation, the person said.
-----------------------------------
*We could possibly see some volatility this week with this meeting.

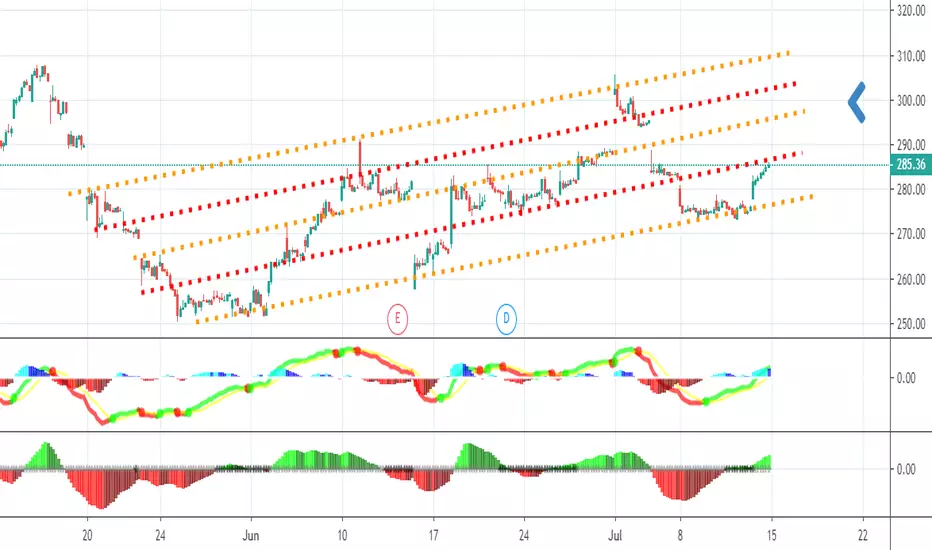
AVGO stock price trend prediction by supply-demand strength.28-Jun NASDAQ:AVGO
Price trend forecast timing analysis based on pretiming algorithm of Supply-Demand(S&D) strength.
Investing position about Supply-Demand(S&D) strength: In Rising section of high profit & low risk
Supply-Demand(S&D) strength Trend Analysis: In the midst of an upward trend of strong upward momentum price flow marked by the temporary falls and strong rises.
Today's S&D strength Flow: Supply-Demand(S&D) strength flow appropriate to the current trend.
read more: www.pretiming.com
D+1 Candlestick Color forecast: GREEN Candlestick
%D+1 Range forecast: 4.0% (HIGH) ~ 0.4% (LOW), 2.1% (CLOSE)
%AVG in case of rising: 2.1% (HIGH) ~ -0.5% (LOW), 1.5% (CLOSE)
%AVG in case of falling: 0.5% (HIGH) ~ -1.7% (LOW), -0.8% (CLOSE)

Broadcom fate depends on China tradeAVGO earnings report:
AVGO Q2 earnings surpass estimates
Q2 quarterly report represents an earnings surprise of 0.77%. A quarter ago, it was expected that this chipmaker would post earnings of $5.19 per share when it actually produced earnings of $5.55, delivering a surprise of 6.94%.
Over the last four quarters, the company has surpassed consensus EPS estimates four times.
However...
We saw a drop of 12% after hours. Today it regain 6%. If AVGO stays above the 200SMA we could see a big potential upside.
Please check chart for more information on specifics.

30 Year Micron Chart... Very InterestingWe are currently sitting on the original kick-off line dating back to 1993. This line may provide the support for an eventual move towards the 2000 ATH of 98+


AVGO SHORT, opportunity The overall structure is a ABC correction up
Within C we have 5 other waves
The 5th wave is either going to end at the 2: or 2.272, trend based fib extension, which makes 269-270 a very good short opportunity. (Within the red box)

ADDED 1,000,000 SHARES - POSSIBLE BUYOUTWe heard a rumor that at least two to three large chip companies approached Micron about a takeover.
Is the rumor true, we are trying to find out.
We can say this, after looking at the stocks / P/E's of lesser public companies, in the computer / technology industries and other industries, and then looking at the price of Micron, if the company is not purchased by Intel (INTC), Qualcomm (QCOM), Taiwan Semiconductor (TSM), Qorvo (QRVO), Microchip Technology (MCHP), Western Digital (WDC), Broadcom (AVGO) or someone else, it will be a miracle.
Look at Cracker Barrel (CBRL), trading at 19 x trailing 12 months, with a P/E of $9.00...STOCK PRICE = $172.00 (yes, we understand it's a restaurant - that doesn't change earnings for earnings or P/E for P/E)
So, even if Micron sales drop, and E.P.S drops to between $8.00 and $9.00, the stock should be trading upwards of $175..? No..? E.P.S is E.P.S right...?
Cracker Barrel has a market cap of only $4.2 Billion while Micron has a market cap of $41 Billion...
Look at MCHP, trading at $73.00 with a market cap of only $17 Billion... P/E....? 32 x trailing 12 months...? OMG!
Look at QRVO, trading at $63.50 with a market cap of only $7.7 Billion... P/E...? 460.33 x trailing 12 months...? OMG!
MICRON is one of a handful, if not the only UNDERVALUED STOCK ON THE STOCK EXCHANGE
Corrupt Analysts calling for more of a drop in the price of Micron could soon be kicking themselves in the teeth!
We will continue to keep adding Micron to our portfolio at these FIRE SALE PRICES!
IT'S REALLY DISGUSTING WHAT IS HAPPENING TO MICRON!
WALL STREET HAS MICRON ALL WRONG AND SOON, THEY WILL ALL BE JUMPING OFF BUILDINGS!
HAPPY THANKSGIVING TO ALL OUR FOLLOWERS!

[AVGO] Phase 4The price is below the 30MM from two weeks ago. But, maybe it's a phase 1 with a clear resistance. What do you think?

do not chase parabolic moves.buy rosh hashana SELL yom kippurThe old adage , buy rosh hashana SELL yom kippur, couldn't come at a more perfect time. Even the veterans on wall street like ART CASHIN stated that rosh hashanah buying began earlier than expected. That's bad news for anyone that held AMD. Why? well, for one, markets gone down in general so not good, second, AMD just had an incredible parabolic run and what did we learn from bitcoin when that happens. third, add trump, add yom kippur selling (keep in mind yom kippur begins WEDNESDAY NIGHT) that means SELLING occurs on monday and tuesday to unload shares prior to the wednesday holiday. Its a situation where there is fasting for an entire day (much like the muslim holiday ramadan) do you think the smartest guys in the room are making huge bets for their institutions when everyone else can trade that day and they cant, on an empty stomach? Sure, call me out and call this trivial, but look at the history. The facts are right there. I LOVE AMD, but right now I DONT. and thats ok. Get out while you can, do yourself a favor, turn yourself away from the stock market if you're perpetually long and save face. If you're short, this is your literal DREAM. I wish only the best of luck to the smartest guys using tradingview platform. Ive learned so much from the community here and i want to be able to GIVE BACK. God bless you all and i wish you millions if not billions in your individual brokerage accounts and/or retirement accounts. GODSPEED. NASDAQ:AMD NASDAQ:INTC AMEX:XSD

$AVGO Swing trade idea$AVGO Swing trade idea - Nice gap since two days, now its holding 100SMA. Let's wait if it tries to catch 20SMA in next two days. Then our limit price will get triggered.

THE WEEK AHEAD: AVGO EARNINGS; EWZ, GDX, XLooking at what's left of the trading week post-Labor Day ... .
AVGO (announcing earnings on Thursday after market close) is the only fairly liquid underlying that interests me for an earnings-related volatility contraction play (rank 57/30-day 37). The 63% probability of profit Sept 21st 200/205/235/240 iron condor pictured here is preliminarily going for 1.65 with a theta of 5.17 and a net delta of .67 with wide bid/ask showing in the off hours. Unfortunately, those 5-wides aren't available in the October monthly at the moment, so be mindful of the fact that you may experience difficulty or have to adjust on roll out if you have to since there aren't any 205's or 235's in the October yet.
EWZ is still in a state of high anxiety with a 52-week rank in the 90's and the 30-day above 40%. The 72% probability of profit October 19th 28/38 short strangle camped out around the 20 delta is still paying over a buck (1.28), which is nice in a sub-$35 underlying.
GDX (rank 44/30-day 26): Gold and silver have had the bejesus beaten out of them, so it's no surprise that the implied is relatively high here. Given the beat-down: October 19th 19 short straddle, 1.37 credit, 18.21 delta (bullish assumption). Alternatively, October 19th 19 short put (synthetic covered call), .87 credit, 59.74 delta.
Lastly: another underlying that's gotten a smack-down -- X (earnings announced 31 days ago). The October 19th 27/33 neutral assumption short strangle is paying 1.06, but I could also see going plain Jane 30-delta short put (bullish assumption) -- the October 19th 28's paying .83; going 70 delta synthetic covered call -- the October 19th 32's paying 2.94; or going skewed short straddle -- the 40 delta October 19th 32 short straddle's paying 3.67, with the strategy selected matching the strength of your assumption ... .

Micron (MU) - BUY BUY BUYOkay, so I must say that I'd started a post and it got lost, so I'm going to condense this one out of frustration and for the sake of brevity.
Technicals -
This weekly chart shows that shares broke their upward sloping trend line (white line), and it also experienced a bearish breakdown of the R.S.I. (yellow circle). The MACD also confirms this bearish trend. Although not depicted on this chart, shares fell below their 200-day moving average today, which was at $49.97.
Back to the weekly... there are two swings, a major (tan lines) and a minor (blue lines). As such, I'll present the supports as zones rather than absolute levels. The first zone of support comes in at $43.53-45.76. The next zone is at $37.00-41.29. The last zone is around $26.85-30.48. The support at $26.85 is the low from Aug. 2017. Underneath that, there's one more support level at $21.19.
Let me be clear in saying that I don't think we break down beyond the $41 area, as its major support. In fact, I doubt we go too much further from here, so I'm targeting the first zone at, say, call it $43-46.
I added to my long-term position today and will be looking to add more on additional weakness. I also bought some September calls in my shorter-term trading account.
Fundamentals -
Shares are dirt cheap. At current prices, it's trading at 4x 2018's estimated earnings ($11.77), and at 4.1x 2019's estimated earnings ($11.60). The PEG ratio is 0.14, price/sales is 1.9x, and price/cash flow is at 2.9x. All metrics suggest a great value.
Finally, while MU doesn't pay a dividend (which I believe will soon change), it's worth noting that the company recently authorized a $10 billion buyback program, which given its $55 billion market cap, equates to over 18% of the float being bought back, and obviously that should bolster E.P.S. figures significantly.
Given the volatile nature of this name, I suggest scaling in and using this weakness as an "accumulate" setup.
Sure, memory pricing will go up and down, but let's be real... the need for data storage/memory is not going away anytime soon. There's also the "crypto effect" at play, as Micron is in that industry as well, so if any recovery in BTCUSD, LTCUSD, ETHUSD, XRPUSD, etc occurs, Micron should benefit (along with NVDA).
Bottom line - BUY BUY BUY. This thing is too cheap to pass up, and the current risk/reward is growing more and more compelling as share prices decline.

Head and Shoulders? Maybe a good shorting opportunityI'm new to this, but it seems to me that today AVG formed a H&S. If it breaks the 239, then probably will go down to ~223 on this H&S pattern. lets wait and see

Broadcom soon to riseThe pink line represents long term trend and the green one a resistance that, if crossed, can signal a bullish trend. Moreover, the company just moved its fiscal domicile a few days ago to the US, so a new attempt of taking over Qualcomm is likely (this time it won't encounter president Trump's opposition).
Feel free to comment and share your opinion.

Broadcom covering the GapAVGO covering the gap. Target around 251.93. Second one at 237.37.
Have a Good Trading Week,
Learn how to beat the market as Professional Trader with an ex-insider!
Cream Live Trading, Best Regards!
