SLP pullbackI’ve been holding for a while I bought at 0.06 and have been expecting a MASSIVE rocket after a nice little pullback. Long term I have no faith in this coin I don’t have a tp for it yet. I am very bullish for now though. NFA
Axieinfinity

CRYPTO : THE AXIE INFINITY (Daily).AXSUSDT is at a very interesting point to buy for me, why ?
1. at their ATH
2. at neckline of their double bottom
3. make a bullish penant
4. STILL at their consolidation area
Wheter that is a penant or a double bottom, the important thing is it still consolidation area and i think it still good till 110. Always remember to using stoploss anyway ;)

AXS Price Rallies 45% To $1.27 Buoyed By Facebook Rebrand
Axie Infinity price skyroketted to areas above $155 as the AXS reacted to the news that facebook was rebranding to Meta.
A rise above the immediate resistance around $150 could see AXS rise to tag new highs.
Facebook’s announcement of October 28 that it was rebranding to Meta was an affirmation of its ambitions to go beyond online social media to build a metaverse. These news triggered a speculative rally cross NFT and Gaming cryptos in the Metaverse.
Decentraland (MANA) jumped by as much as 80% between October 28 and October 29 with its market valuation exploding from $1.44 billion to over $2.08 billion in just 24 hours.
AXS, a native token to Axie Infnity, a Pokemon-styled “play-to-earn” pet training game and virtual world also rallied by as much as 22.5% to hit a two-week high above $160. AXS is Axie marketplace’s legal tender where players use it to purchase digital pets (in-game NFTS).
AXS Price Takes A Breather Above $140
Axie Infinity rallied over 39% from a low of $117 on October 28 to a high of $163 on October 29. This rally was rejected by the $150 resistance level which has since seen the AXS price correct to the current price around $142.
AXS is trading with a bearish bias above $140 and slip below this level could see it lose the recent bullish momentum to tumble towards the $125 support wall.
A slip below this could see a safe haven at the demand one between $108 and $114 shown by the green band.
On the upside, if AXS price overcomes the selling pressure from the supply zone between $148 and $155, the Axie Infinity Token will rise to discover new record highs above $155.
The upsloping moving averages and movement of the MACD in the positive region validate this bullish outlook. Morever, the position of the Relative Strength Index (RSI) indicator at 63 close to the overbought one shows that the bullish momentum still has some strength.

#Axie_Infinity #AXS: The Bull Run of Q4 (4X)#Axie_Infinity #AXS: The Bull Run of Q4 (4X)
500-700$ Potential of 4X

This is it $SLP!$SLP just broke its long term RSI Resistance. This is bullish. Buy and Hold guys. Buy and Hold!

AXS- New Trendline breakout COINBASEPRO: AXSUSD
4 HR Chart
- Axie is looking very good.
- The price has been in accumulation since early October.
- We have had a sharp recovery after retesting the bottom of the symmetrical triangle.
- The price is now breaking the trend line at $133, a long position is now available with the conformation of the breakout. (4hr candle closure) .
Profit Targets:
Short term TP 1- $155
Mid term TP 2- $180

AXS moonshotAXS is on the move right now, extremely urgent for entry. Target profit 93% out from my current entry price

🐦AXS symmetric triangle (continuation)AXS/USDT (2h) formed a symmetric triangle (continuation pattern). The price broke out of the formation and is testing the key level (129.9) and the orange trendline as support. If we see a bounce from here than it's super bullish. If not, the price will most likely dive deeper back down into the formation to find a support level.
TP1: 134.21
TP2: 141.26
TP3: 145.48
TP4: 153.49
TP5: OPEN++
-- Note: Keep in mind that AXS is a native currency of Axie Infinity(p2e game), which makes it's price very vulnerable to any gameplay changes made by the dev team --

AXS/USDT (long term)AXS has broken the triangle formed ,confirming the bullish trend for the long term.
AXS is a good coin for holding targeting 220$ - 275$ - 390$.
chart (daily)

$AXS /USD, Just 5% away from a new ATH $AXS /USD
Just 5% away from a new ATH
Has been trying for almost a month now to break above ~135$ with strength
UCTS remaining bullish across all HTFs (30% up since latest UCTS 1D Buy)
Its not an IF but a when will break above
Just wait for it 😏
#AXS

AXIE super bullish - long!!!#AXS just broke through the upper boundary off the symmetrical wedge. The breakout was confirmed by the successful retest of broken line. The next leg of this rally will likely reach the ATH at 233$ because of hype on play-to-earn games now.

AXSUSDT Axie Infinity Next Big Move Coming !?!AXSUSDT is again making good upward moves. Just like the previous waves can it make new all time highs?!. we can attempt to take a ride of it with stop losses levels mentioned for risk management

AXIE BREAK AXIE LOOKING TO BREAK THE FLAG AND MAKE A MOVE TO THE UPSIDE - upside target obtained from fib, fib removed from chart for clarity

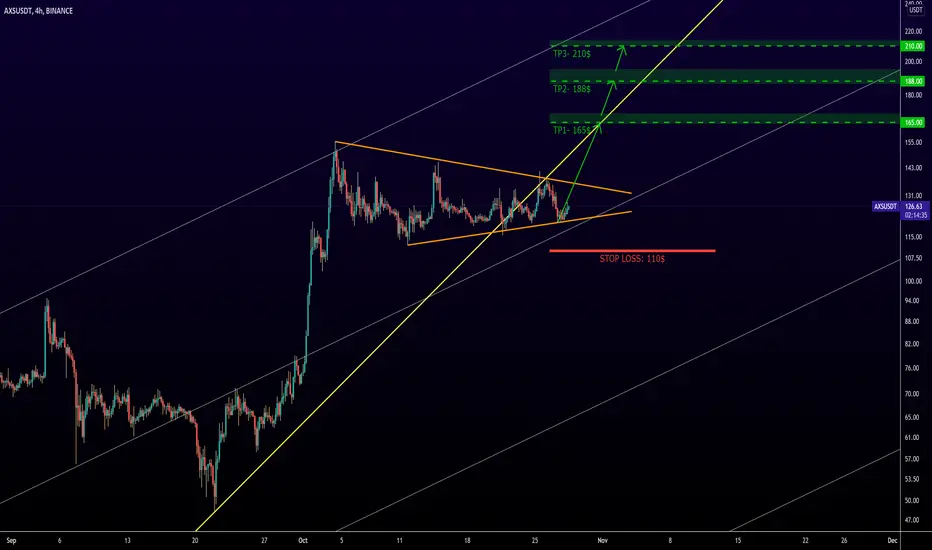
#AXIEINFINITY #AXS 4H TECHNICAL ANALYSIS
Due to the long-term uptrend channel and the formation of the triangle pattern, as well as approaching one of the levels of the uptrend channel, due to the help of Fibonacci, there is an expectation of price growth to one of the following TARGETS.
TARGET1: 165
TARGET2: 188
TARGET3: 210
STOPLOSS: 110$
ENTRY : 128-122
TIME: 1-3W
AXSUSDT long Axie dropped to the support area of the triangle, the stochastichs RSI is oversold.
Entry - 122.719
SL - 119.258
TP - 138.190

Bring on the bois1+1=2
This chart is as easy as that.
$SLP - Buy a bag & wait. It'll pay for your next 10 bags.
Go well, and prosper.
xx


AXS LONG TRADE - AXIE INFINITY Our favourite volatile trading alt finally broke up from the symmetrical triangle and ready to retest ATH!
Take profit in three stages, TP1 $155 (ATH). If bulls take charge and momentum continues then next targets are TP2 $171, TP3 $232
*NOT FINANCIAL ADVICE
**ONLY TRADE WHAT YOU CAN LOSE

AXS To New All Time HighsAXS Been Consolidating For 26 Days And Now Broken Out Aims For Targets Till 165 And Above
Fundamentals are strong so are technicals Holding is not a bad idea

AXSUSDT broken triangleWait for the price to retest the breakout then enter trade.
Not financial advice do your own analysis.
Good luck people
Enter around 137.024
SL 133.260
TP 145.498


SLPI think this baby is ready to fly after crossing the resistance (red line)
looks like AXS is doing well, and also whole the market.
do you think SLP can reach its ATH?

AXS UPDATE TARGET 1 MET!ALICE UPDATE!
Cleaned up the chart.
Target 1 met, we have 2 more short/medium targets to hit.
Long term target $190, NFA.
