AXISBANK


AXISBANK touched the resistance at 384, Now expect the fallAXISBANK has recently touched the mirror level of 384
Now, the down move had begun
I had added a short, If got more opportunity I will add more shorts at better price
If market open above and starting moving down, more shorts
Target will be 365 for short term, intraday


no one can predict the future, no one.so ignore arrow drawing, focus only at major, support and resistance. take decision nr to support and resistance for the best risk/reward.


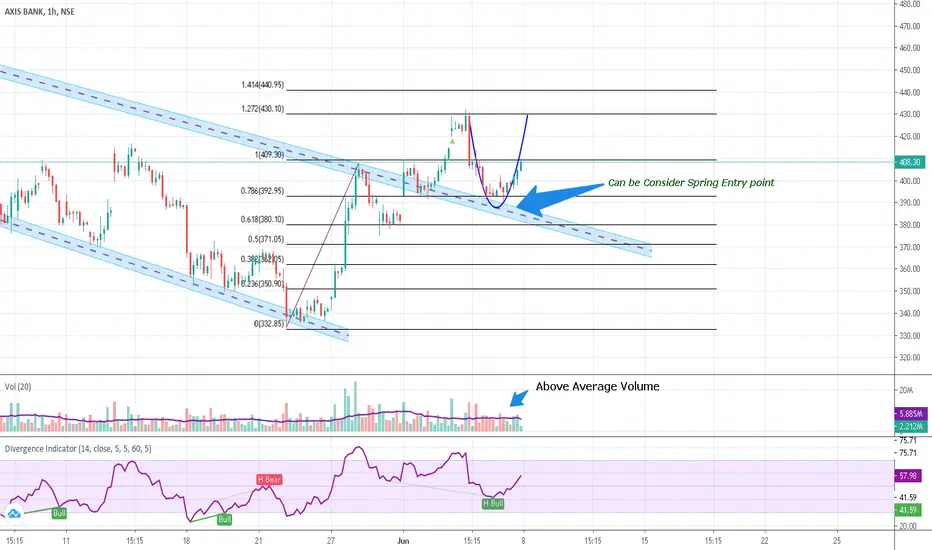
Axis Bank from 6 June 2020Channel has been broken ... spring entry position also validated .. cup formation expected ..
buy only above next fib level ..with good volume breakout.
Axisbank @ crucial levelsAxisbank 385 Strong bounce back zone.
Below that 375/368 possible...
Strategy... near 375 / 368 buy 400CE


Axis Bank Levels to watchAxis Bank closed at 384.95 and could test it's strong support level 369
Levels to watch
if -GAP UP OPENING ABOVE 389.22 then can see 15 point moment upward
if -GAP DOWN OPEN BELOW 368.09 then can see 10 point moment downward

Axis Bank What do next After Heavy rally ?Hello Guys, That's My first Analysis On-axis Bank Please gives like And support my ideas
How are you doing nowadays If you are still not making profit then contact Me,
As you can be seen In chart Its Gives breakout bt Not done retest and now currently Moving below Excess Price I am looking for short in axis bank for target 470-450
Thanks


AXIS BANK: GANN FAN? Will break support? Let's see this weekAXIS BANK: GANN FAN? If it breaks support of 350 It may head to big correction. Next support near 305 levels
Possible Correction of 12-15% ahead...

AXIS BANK - Short SetupLooking at AXIS bank,
Its trading in range from past 1-2 weeks & considering weak Bank NIFTY, we can capture short opportunity in AXIS Bank.
Based on Hourly chart, incase if breaks 385.5 level,
we can go short ... support levels are drawn on chart

SBIN Good Time to BUY for LONG 166 SL 160We are doing Analysis of SBIN on 1 Hour Timeframe.
The projected target from the breakout is usually the vertical distance from the high to the bottom .
Note: This is only for Educational Purpose this is not an Investment advice.
Please support the setup with your likes, comments and by following on Trading View.
Thankyou
Ankur Verma
Twitter : Ankurverma3838

AXISBANK - GO LONG FOR A RR OF 1:7 TOMORROW MORNINGAXISBANK - GO LONG @ 401 WITH A SL OF 399 AND A TARGET OF 415. TARGET SHOULD BE ACHIEVED BY 27 APRIL 2020, 1ST HALF.

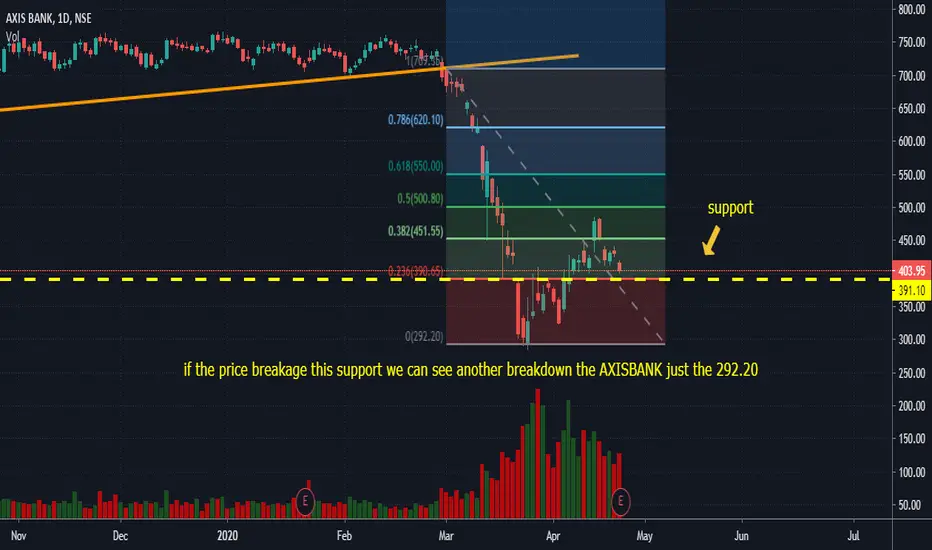
pay attention : potential breakdown the AXISBANK stockf the price breakage this support we can see another breakdown the AXISBANK just the 292.20

Daily Chart of Axis BankDaily Chart of Axis Bank:
On daily chart the stock is moving in tight range of 60-70 Rs. The stock is holding the support zone of 590-600 levels and facing stiff resistance around the zone of 660-670 levels since the month of November-2019. Break out on either side will decide the further trend in the stock.

ICICI Bank Long Build up in IntradayHey Everyone,
You had caught a good short from our previous harmonic PRZ and made good profit there. Now I had found an another swing and its a long setup . Good setup for swing and Intraday as well .
Buy Area 418-422
Stop Loss : 414
Target : Open

0001 Axis BankClassical Chart Pattern: Rectangle
Previous Trend: Bulish
Above: 200 EMA
Remark:
Breakout above 760
Traget 820

Axis Bank OutlookAxis Bank results today if negative then can open up range of 680-670. if results are positive can open range of 735-755
