AXIS BANK - DAY CHART - 09.01.2023 - BAHAVAN CAPITALAXIS BANK as per Day Chart Analysis Stock
ABOVE 962 TARGET 970
Today FII Net selling had come down considerably to 203.13 Cr and DII Net Buying increased to 1723.79 Cr.
Nifty Once Breaks the resistance at 18169 then the target is 18240 level.
Bank Nifty Once Breaks the resistance at 42716 then the target is 42932 level
Tomorrow Market trend to be on the positive side..
Happy Profitable Trading to all...
AXISBANK

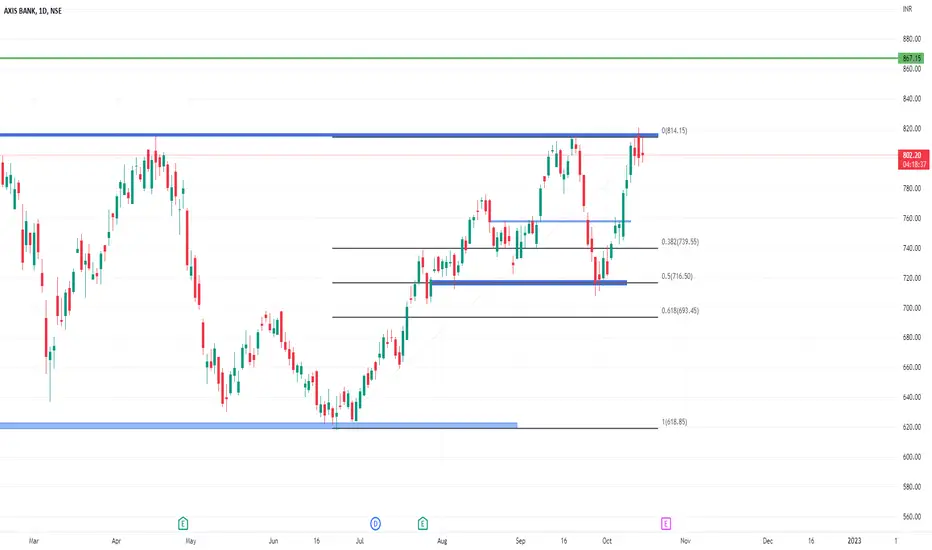
AXISBANK : Trading at 52week high#AXISBANK good strong breakout after 2 failed attempts
>> If it Retraces, accumulate till safe entry levels
>> If it doesnt Retraces, enter above previous high levels
Targets as per Fibonacci
Good Strength in stock
Take 5-10% and Keep trailling
Keep Learning....Keep Growing....Keep Trading
Follow for more Learning

Axis Bank going Up 📈Keep Eye on Axis Bank as Expected Target Price would be 992 🎯 ( Swing Trade )
Note : This is just for Backtesting and Educational Purpose.

AXISBANK- Breakout Bullish SetupAxis bank has given a breakout from its Resistance zone and volume profile showing high volume traded at a near higher price, it is giving high probability to continue uptrend after a breakout above @965 level.
Entry Level:- Above @965
StopLoss:- Below @958 After breaout of level @965
Target:- 1:1 or 1:2

DAILY TIME FRAME - AXISBANKThe Structure looks good to us, waiting for this instrument to correct and then give us these opportunities as shown on this instrument (Price Chart).
Note: Its my view only and its for educational purpose only. Only who has got knowledge about this strategy, will understand what to be done on this setup. its purely based on my technical analysis only (strategies). we don't focus on the short term moves, we look for only for Bullish or Bearish Impulsive moves on the setups after a good price action is formed as per the strategy. we never get into corrective moves. because it will test our patience and also it will be a bullish or a bearish trap. and try trade the big moves.
we do not get into bullish or bearish traps. We anticipate and get into only big bullish or bearish moves (Impulsive Moves). Just ride the Bullish or Bearish Impulsive Move. Learn & Know the Complete Market Cycle.
Buy Low and Sell High Concept. Buy at Cheaper Price and Sell at Expensive Price.
Keep it simple, keep it Unique.
please keep your comments useful & respectful.
Thanks for your support....
Tradelikemee Academy


Axis bank 15 minAxis bank formed triple top it is already at higher high if candle breaked trendline we will sell the
axis bank or else it breaked the resistance we will be on buy side

Bank Nifty Levels & Option Data for 12/Dec/2022Dear traders, I have identified chart levels based on my analysis, major support & resistance levels. Please note that I am not a SEBI registered member. Information shared by me here for educational purpose only. Please don’t trust me or anyone for trading/investment purpose as it may lead to financial losses. Focus on learning, how to fish, trust on your own trading skills and please do consult your financial advisor before trading.
Please find below scorecard, PCR update & options statistics for your reference:
BANK NIFTY SCORECARD DATED 09/DEC/2022
BANK NIFTY IS UP BY 37 POINTS
Name Price Previous Day Change % Change
Bank Nifty 43633 43597 36.60 0.08%
India VIX 13.48 13.40 0.08 0.60%
OPTION STATISTICS BASED ON 15/DEC/2022 EXPIRY DATA
Max OI (Calls) 44000 (Open Interest: 2219650, CE LTP: 88.65)
Max OI (Puts) 43500 (Open Interest: 1850050, PE LTP: 181)
PCR 0.91 (PCR is in bearish zone)
Bank Nifty Calls:
ATM: Short Buildup, OTM:Short Buildup, ITM:Long Liquidation, FAR OTM:Short Buildup
Bank Nifty Puts:
ATM: Short Buildup, OTM:Short Buildup, ITM:Short Buildup, FAR OTM:Short Buildup

Axis bank multi year breakout and retestAxis bank Chart is recently breakout from multiyear resistance. and retestead that level also
Entry: near cmp
Stop loss: if close below 820
Target : as per your risk/reward ratio
⚠️ Important: Always maintain your Risk & Reward Ratio.
⚠️ Purely technical based pick.
✅Like and follow to never miss a new idea!✅
Disclaimer: I am not SEBI Registered Advisor. My posts are purely for training and educational purposes. please consider it as a lerning
Eat🍜 Sleep😴 Job & swing Trade📈 Repeat🔁
Happy learning with Earning. Cheers!🥂

Why one should add longs/invest in banknifty!!The banknifty has exited its rectangle channel pattern at the end of a volatile week.
After today's amazing run, especially in PSUs, one might add long by keeping the SL of 42800 in the Banknifty.
A strong surge is expected in the next few days because all the good and large banks are supporting this movement.
Bankbees can be purchased to ride the rally🚀. (Recommended)
One can choose to go with options and futures as well, but the risk is also very big there, so one needs to prioritise safety first.
Don't forget to follow;)
Follow for your learnings✌️

AXISBANK CHART ANYLAYS BRAEKOUT POINT AXIS BANK 908 to 909 is most impotent level is AXIS BANK
breakout this point 908 to go up this target 918 and up side clear move
NSE:AXISBANK

At a Resistance, may face rejection Fin nifty is moving with taking resistance the trendline, friday we saw the price well respected the trendline and we saw some profit booking, profit booking may continue today as well

Axis Bank Hey traders this is Axis bank hourly chart this is in range of 860 to 880
above 880 will be good for buy side
Below 855 will be short

Giving 2nd opportunity to initiate Long Refer the chart for detailed analysis.........................

INTRADAY AXISBANK IN 5MIN TF31/10/2022
LONG SIDE
INTRADAY(5MIN)
AXISBANK
Trendline breakout in 5MIN TF taking support from support line retest happened in 5min tf bullish structure(Higher Highs and Higher Low)marubozu formation in 5min tf
ENTRY-904.7
SL-902.3
TARGET-909.5
R:R-1:2
MOVE-0.53%

AXIS BANK LOOKS GOOD FOR SHORT TERM.Axis bank looks good for short term, earnings came up with +ve also it has given a strong BO. from cmp we can aim for two targets.

AXIS SWING TRADE OPPORTUNITYWe can clearly see an inverted HNS and trend-based Fibonacci extension
NSE:AXISBANK

Axis bank leading to All time HighNSE:AXISBANK
Good Support at 816
Wait for result on 20 oct 2022 and can take position.
PS: Please do your own analysis before the taking any position

AXIS Bank Swing High Break*AXIS Bank*
Time Frame: Daily
Observation:
* Swing High Break
* Base Formation At 721 742
* Mean (EMA) Diversion on Daily Time Frame
Resistance/Target: 909 1025 1141 1214
Support 772 720

#Axis BankShot levels respected twice and gave decent gains.
Two days same levels worked as resistance and finally moved up.
Neutral view for now

AXIS BANK Short Opportunity 30MTF based on 3 simple indicatorsIndicators: Bollinger bands, 200EMA and RSI
Trade Conviction:
RSI strength is decreasing
IF price breaks down 5 days average price then only we can see good down move
Dear traders, I have identified chart levels based on my analysis,
major support & resistance levels. Please note that I am not a SEBI
registered member. Information shared by me here for educational
purpose only. Please don’t trust me or anyone for trading/investment
purpose as it may lead to financial losses. Focus on learning,
how to fish, trust on your own trading skills and please do consult your
financial advisor before trading.
Please do review, analyse and share your comments as well.
Let us work and win together. Wish you a very happy, healthy & profitable trading day ahead!
Disclaimer: I have analysed the data based on my limited knowledge.
I am not a SEBI registered member. Information shared here for educational purpose.
Please don’t trust me for trading as it may lead to financial losses.
Please consult your financial advisor before trading.

AXISBANK- 240 MINS TIMEFRAMEHi there,
The Structure looks good to us, waiting for this instrument to correct and then give us these opportunities as shown on this instrument (Price Chart).
Note: Its my view only and its for educational purpose only. Only who has got knowledge about this strategy, will understand what to be done on this setup. its purely based on my technical analysis only (strategies). we don't focus on the short term moves, we look for only for Bullish or Bearish Impulsive moves on the setups after a good price action is formed as per the strategy. we never get into corrective moves. because it will test our patience and also it will be a bullish or a bearish trap. and try trade the big moves.
we do not get into bullish or bearish traps. We anticipate and get into only big bullish or bearish moves (Impulsive Moves). Just ride the Bullish or Bearish Impulsive Move. Learn & Know the Complete Market Cycle.
Buy Low and Sell High Concept. Buy at Cheaper Price and Sell at Expensive Price.
Keep it simple, keep it Unique.
please keep your comments useful & respectful.
Thanks for your support....
Tradelikemee Academy
