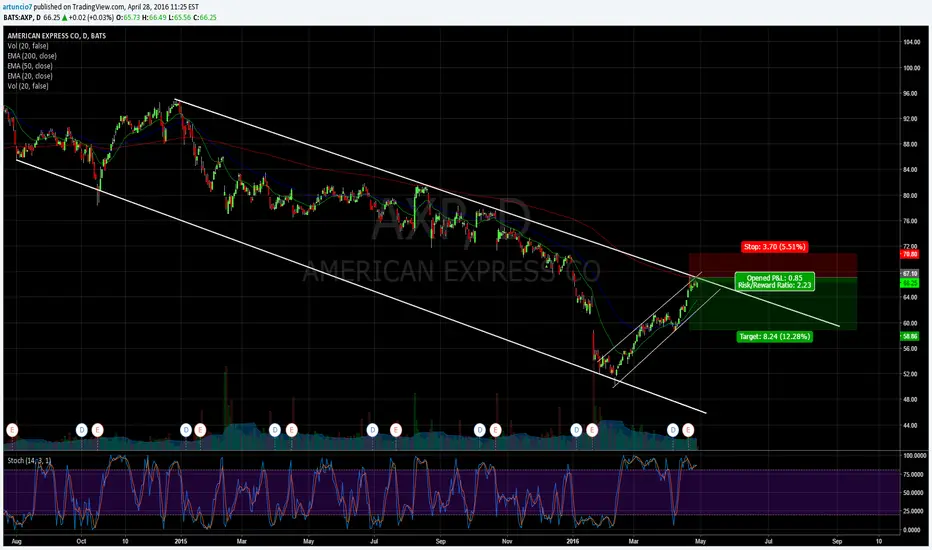
AXP: Triggered a bi-weekly uptrend after earningsAXP has a very interesting setup here, and it appears it can rally strongly over $80 from here.
The setup is a bi-weekly 'Time at mode' uptrend, so we can enter longs at market risking a reasonable $4.59 per share, for a total of position of 3.5%-7% of your capital (no need for a stop loss).
Good luck!
Ivan Labrie.
AXP

AMERICAN EXPRESS @ 30 min. Chart @ Outbreak still shiftedactuallity basic downside trendline
66.71 (08.09.16) start of the actuallity downside trendline
66.09 (12.09.16) end of the actuallity downside trendline
63.90 (23.09.16) where the extended trendline was on last trading day
63.85 (23.09.16) Friday (last trading) Closed
66.09 (12.09.16) based on actuallity downside trendline (end of the actuallity down side trendline)
64.13 (05.08.16) based on actuallity downside trendline (1st low of trading range in an higher broader trading zone)
65.08 (22.09.16) 1st target after false breakOUT of the actuallity downside trendline
trading range in an higher broader trading zone
66.28 (23.08.16) 3rd high of trading range in an higher broader trading zone
66.25 (08.08.16) 2nd high of trading range in an higher broader trading zone
66.09 (12.09.16) 1st high of trading range in an higher broader trading zone
64.13 (05.08.16) 1st low of trading range in an higher broader trading zone
64.41 (16.08.16) 3rd low of trading range in an higher broader trading zone
64.52 (08.08.16) 2nd low of trading range in an higher broader trading zone
64.57 (09.09.16) 4th low of trading range in an higher broader trading zone
63.85 (23.09.16) Friday (last trading) Closed
higher broader trading zone
66.70 (08.09.16) 3rd high of the higher broader trading zone
67.33 (21.04.16) 1st high of the higher broader trading zone
66.58 (07.06.16) 2nd high of the higher broader trading zone
63.85 (23.09.16) Friday (last trading) Closed
63.16 (16.09.16) 3rd low of the higher broader trading zone
63.18 (02.08.16) 2nd low of the higher broader trading zone
62.88 (21.07.16) 1st low of the higher broader trading zone
high of the higher broader trading zone
63.96 (23.09.16) 100 Daily SMA
63.85 (23.09.16) Friday (last trading) Closed
63.41 (18.08.16) Golden Cross BUYING Signal
62.51 (23.09.16) 200 Daily SMA
63.38 (20.06.16) high before BreakDOWN & trend-reversal-formation
63.27 (23.06.16) high before BreakDOWN & trend-reversal-formation
62.30 (19.05.16) low before a trend-reversal-formation was created (while june & july)
Take care
& analyzed it again
- it`s always your choice ...
Best regards
4XSetUps

AXP - still showing strength.I was closely watching AXP after it was previously rejected at the 200 MA, however the drop didn`t really go far and it seems as if strong hands are still supporting further gains. Look for this gap close around 66.42 USD & then possibly still further upside.
P.S. Congratulations to all followers who participated in BABA after my call-out :-)


$AXPLooks like interesting short. Stochastics on 1H chart are bearish also you can see topping pattern
AXP - weekly chart target almost reached.Caution is warranted for bulls, as the rebound in AXP has taken price almost to its first major target. Earnings were a positive surprise, but - as with all financials - we still have to watch if this is real buying or just a counter-trend rally.

AXP - American Express finding support.Depending on the general market, further recovery in AXP off support at 52.00 USD could take it back to 65.00 and 67.43. Should we see declines in Indices I expect a sideways price behaviour in AXP, but as long as 52.00 USD holds I will be cautiously bullish.


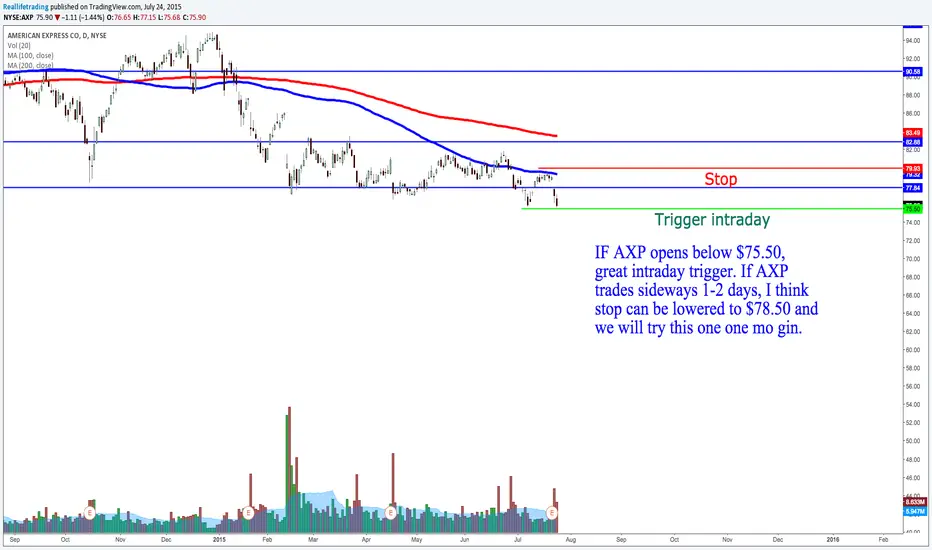
DOW JONES OVERVIEW: AMERICAN EXPRESS RISKS TO TAG 5-YEAR MEANAmerican Express has fallen below 1st standard devations from quarterly (66-day) and yearly (264-day) means, thus entering short term downtrend
Price is also trading within 1-st standard deviation from 10-year (520-week) and 5-year (260-week) moving averages, meaning that it is in lateral trend on long term basis
If the short term downtrend holds (price trading below 76.4-77.1 levels), there is a high probability to tag 5-year mean at 75 level
Scenario is canceled, if price returns to trend on 10-year basis by spiking above 1st standard deviations from 10-year mean (above 80)

AXPLonger term bullish trade. Buying low, selling high is the plan. Good gap back in 10/13 acting as support.

AXP Long Trade Plan Based on DemandWith the S&P trending up and at weekly demand and AXP basically
mirroring it, having pulled back to an objective level of weekly
demand from the pivot low in mid oct 2014 where price
rocketed off. I am hoping that there will be some unfilled
buy orders or a large enough supply/demand imbalance to push price
higher. My entry on this trade will be a tick above 82.35.
Should it trigger I will use a time stop as IMHO if momentum doesn't
step in shortly it probably isn't there.
