Axie Infinity Trades Within Opportunity Buy Zone · (PP: 16,253%)Right now Axie Infinity is trading within the "opportunity buy zone," this is a level just below the support zone from 2024, 2023 and 2022. It is trading in this zone searching for liquidity. Once this move is over, AXSUSDT will never be available at these prices in the future. The lowest will be the long-term support zone from 2022-2024.
Can Axie Infinity hit a new all-time high in 2025 or 2026? It is possible. But, in this chart setup and analysis we are focusing on high probability conservative targets.
"Back to baseline" is the very easy target. The first target after that sits around $20 for 677%. The main target goes higher, $32 for 1,111%. A strong target is $55 and this one opens up 1,983% profits potential.
A new all-time high can be $268 & $435. Really huge numbers. Just to give you an idea, the second one would be equal to 16,253% profits potential. The first one, $268 would be equal to 9,975%. This is theoretically possible so I don't want to commit to it but is good to keep an open mind with market conditions improving at the speed of light. If we can say there is such a thing.
Technical analysis
The bottom in 2025 matches the mid-way stop of the 2021 bull market. So this is an interesting and valid zone for a reversal.
We don't need to go any deeper in looking for reversal signals because a marketwide bullish bias is already confirmed. We've been bullish since 7-April 2025. Some pairs move first others later though and that's why some are already very high while others are very low. This is good because it gives us time to adapt to the market. If everything were to move together at the same time on the same date, it would be too late to buy anything low. Because the market cycles through different sectors, groups and pairs, we can buy the ones that are low now knowing that they will eventually move ahead. Everything grows. Everything will grow. The 2025 bull market is already confirmed.
Thanks a lot for your continued support.
Namaste.
AXS

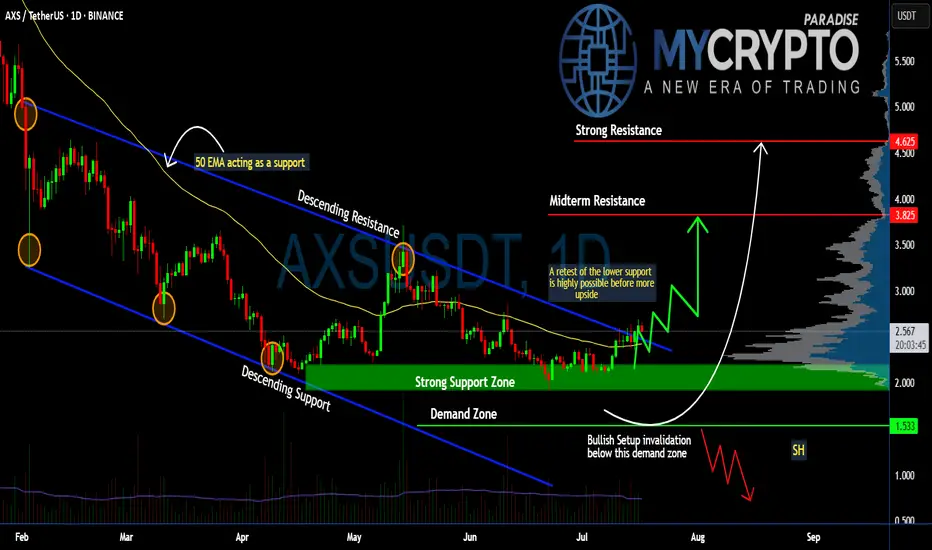
Can #AXS Bulls Sustain the Momentum or Will it Fall? Key LevelsYello, Paradisers! Will #AXS finally deliver a strong upside move, or are we just seeing another setup to trap impatient bulls before a deeper drop? Let’s break down the latest #AXSUSDT structure:
💎After months inside a descending channel, #AxieInfinity has finally broken above the descending resistance, showing early signs of a potential trend reversal. The current price trades around $2.56, but history tells us a retest of lower levels is still highly possible before any sustained upside move. The soaring volume and a positive broader market outlook reinforce our bullish bias.
💎The structure is clear: the strong support zone sits between $2.20–$2.00, and this is the first critical level to watch. A healthy retest here would provide a high-probability continuation setup for bulls. Below that, the demand zone at $1.53 is the last stronghold—losing this level would invalidate the bullish scenario completely.
💎If buyers maintain control, the first upside target stands at the midterm resistance of $3.82, where some profit-taking and selling pressure are expected. A clean breakout above this zone could push the price toward the strong resistance at $4.62, where major distribution could occur.
💎However, the bullish setup becomes invalid if #AXSUSD loses the $1.53 demand zone. A confirmed daily close below this level would flip the structure bearish and open the door for a move to new lows.
Stay patient, Paradisers. Let the breakout confirm, and only then do we strike with conviction.
MyCryptoParadise
iFeel the success🌴
#AXSUSDT #4h (Bitget Futures) Falling wedge breakout and retestAxie Infinity just pulled back to 50MA support where it's bouncing, looks ready for recovery towards 200MA resistance and more.
⚡️⚡️ #AXS/USDT ⚡️⚡️
Exchanges: Bitget Futures
Signal Type: Regular (Long)
Leverage: Isolated (4.0X)
Amount: 4.7%
Current Price:
2.509
Entry Zone:
2.489 - 2.407
Take-Profit Targets:
1) 2.758
2) 2.991
3) 3.224
Stop Targets:
1) 2.189
Published By: @Zblaba
NYSE:AXS BITGET:AXSUSDT.P #4h #AxieInfinity #P2E axieinfinity.com
Risk/Reward= 1:1.2 | 1:2.1 | 1:3.0
Expected Profit= +50.7% | +88.7% | +126.8%
Possible Loss= -42.3%
Estimated Gaintime= 1-2 weeks

AXSUSDT 1D Analysis AXS ~ 1D Analysis
#AXS Buy gradually from here if you still have confidence in this coin with a short term target of at least 15%++

AXS - Dont be faked outWhile the bounce is nice, we should not forget about the real trend here.
We're still bearish overall and there is a shit ton of liquidity to be taken out. Don't be blinded
#AXS/USDT#AXS
The price is moving within a descending channel on the 1-hour frame, adhering well to it, and is heading for a strong breakout and retest.
We are seeing a bounce from the lower boundary of the descending channel, which is support at 3.11.
We have a downtrend on the RSI indicator that is about to be broken and retested, supporting the upward trend.
We are looking for stability above the 100 Moving Average.
Entry price: 3.16
First target: 3.23
Second target: 3.45
Third target: 3.65

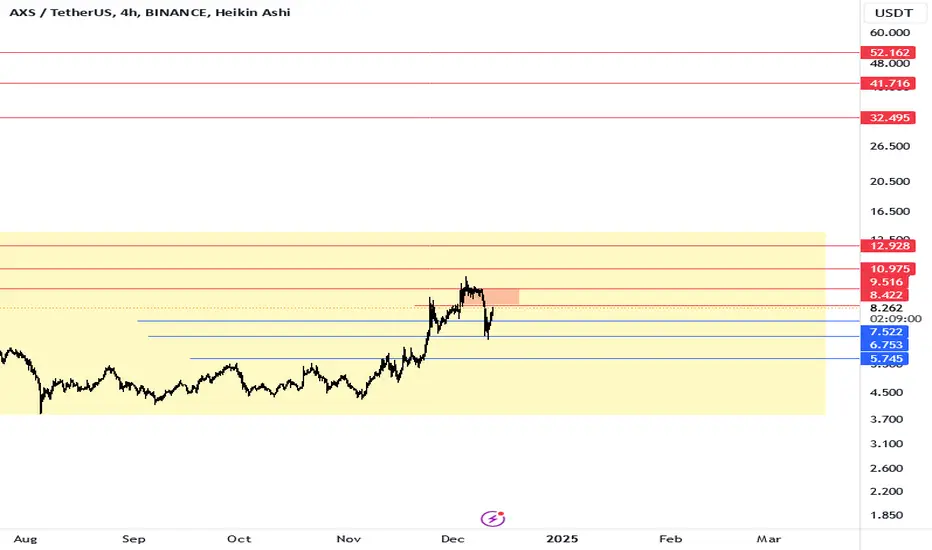
Axie (AXS) Structure Analysis (1W - Log)After retesting the ~$2.0 demand zone, BINANCE:AXSUSDT broke out of its recent downtrend and could be headed for an attempt to reclaim the ~$4.0 S/R.
Key Levels to Watch
• ~$2.0: Demand zone dating back to May 2021, and current support. Any sustained break below it would invalidate any bullish TA.
• ~$4.0: Previous multi-year key support, and likely a strong resistance. Reclaiming it would flip the bias to bullish. It also aligns with the 200-day EMA, which has been very relevant for AXS in the past.
• ~$13.0: Multi-year S/R, and a reasonable target if ~$4.0 is reclaimed.
Still in a No-Trade Zone for me, until ~$4.0 is successfully reclaimed.

AXS: Bullish Possibility for Axie Infinity#AXS was one of the top performers during the 2021 bull run delivering nearly 100,000% returns that year, followed by a 4-years long correction.
Passing $10 shifts the long-term bearish trend into a bullish phase. Breaking $2.22 invalidates this bullish idea.
#AxieInfinity

Can Axie Infinity Grow 8,000%? Let's Ask The ChartAxie Infinity is recovering from a final flush episode this week. The action just turned green after AXSUSDT hit the lowest price in 4 years, since May 2021.
First, it is still early for buyers and Cryptocurrency traders. Why? Because the action is happening at bottom prices. Just look at the chart, truly low prices as AXSUSDT is still trading below its 3-Feb. low but recovered above its March low already.
The recovery above the 10-March 2025 low within a single candle reveals that the bottom is already in. The final drop, which was a strong shakeout or stop-loss hunt event, not a bearish impulse, is over.
On the left side we can see the bear market wave. It lasted an entire year from November 2021 through November 2022.
This bear market is followed by a neutral-sideways market. This is the transition period.
Now the market is set to turn ultra-bullish but before this bullish cycle there is one final shakeout and that's the drop from December 2024 until April 2025. This move is intended to activate the stop-loss of thousands of traders. Once these people sell lower than what they bought, the market changes course. This is why I do not recommend using a limit stop-loss.
As soon as the multi-year low is hit, the market turns green. This is what is happening now, just watch! Axie Infinity is set to grow long-term.
Buy low to sell high.
Never set a stop-loss limit order on an exchange, it is a recipe for disaster. It is better to wait patiently because the market will recover and will produce strong, sustained, long-term growth.
I have two set of targets, the easy-local targets and the "global" targets.
The easy targets are 560%, 927% and 1,660%. The global targets include the potential for a new All-Time High. We will have to wait and see. I don't know of these purple targets will hit, but is good to be prepared.
Hope for the best and prepare for the best.
Thank you for reading.
Namaste.

AXS/USDT: Whale Driven Distribution, Shakeout, and AccumulationAXS/USDT Daily (Dec 2024–May 2025):
Price dropped from $10 to $2, driven by whale distribution and now whale accumulation at the $2–$3 levels. This is based on developing high volume node indicating high trading activity.
Whales sold into FOMO in Dec 2024, triggered panic sells during Feb–Apr 2025, and are buying at current support.
Watch for a bounce toward $5 (VWAP resistance) if volume turns green, or a drop to $2.000 if support fails.
Monitor #axs sentiment on X.com for confirmation. A call for lower prices, lack of interest, fear and general panic in the community, will signal the true bottom!

AXSUSDT 1D AnalysisAXS ~ 1D Analysis
#AXS Buy after successfully penetrating this resistant line with a short -term target of at least 10%+ from here.

TradeCityPro | AXS: Gaming Token at Risk of New Lows or Rebound?👋 Welcome to TradeCity Pro!
In this analysis, I want to review the AXS coin for you. The AXS project is one of the crypto gaming projects, currently ranked 124 on CoinMarketCap with a market cap of $357 million.
⚡️ This project was highly hyped during the previous bull run in 2021, but after a while, the hype faded and we witnessed severe declines in this coin. It is still in a downtrend.
📅 Daily Time Frame
In the daily time frame, as I mentioned, this coin has been in a long-term downtrend, and recently, with the break of the 4.193 level, the next leg of the trend has begun, and the price has moved downward.
✔️ In the previous analysis , if you remember, I told you that to buy this coin, you should wait for the price to stabilize above the 7.366 level, and if it stabilizes below 5.439, a drop could occur.
📉 As you can see, the price never stabilized above 7.366, and after breaking 5.439, a strong bearish trend began. I hope you used this trigger and made good profits from this bearish move.
⭐ We can draw a trendline from the price lows, and in every move the price has made, it has reacted to this dynamic area and started a new leg after some correction.
🧩 Currently, the price is near an important support at the 2.2 area, and both volume and RSI strongly indicate momentum. If this support breaks and RSI enters the oversold zone, we can expect a sharp bearish move from the price.
🎲 The next support the price has is at the 1.355 level, which is the most important price support, and in my opinion, if the price makes another bearish leg, it will react to this area.
⏳ 4-Hour Time Frame
In the 4-hour time frame, as you can see, the price is in a descending channel and has now formed a range box at the bottom of the channel.
💫 The bottom of the box is at 2.2 and the top is at 2.431. A break of the box bottom can bring the price back to the box low again. A break of the box top can start a bullish leg up to the top of the channel.
💥 On the other hand, usually when a box forms at the bottom of a descending channel, the price goes through some time-based correction and likely ranges toward the channel midline.
🔍 Also, pay attention to the RSI oscillator. RSI entering the oversold zone confirms a short position, and a break of the 50 level confirms a long position.
📝 Final Thoughts
This analysis reflects our opinions and is not financial advice.
Share your thoughts in the comments, and don’t forget to share this analysis with your friends! ❤️

TradeCityPro | AXS: Axie Infinity's Play to Earn Dynamics👋 Welcome to TradeCityPro!
In this analysis, I want to discuss the coin AXS, which belongs to the project Axie Infinity. This coin gained a lot of hype during the previous bull run as part of a Play to Earn game.
📅 Weekly Time Frame
In the weekly time frame, we see a very large and long-term range box where the price has been oscillating between 4.221 and 12.610 since late 2022.
🔍 The SMA 99 has even entered the range, indicating a severe ranging market. I do not recommend buying this coin as it has very high inflation, and the coin has a consumptive and reward aspect in the game, leading most users to sell the coin they earn, which is why it has not been able to break out of its range box yet.
🔽 If the price breaks below the support at 4.221, it will be very challenging for AXS as a sharp and heavy drop is very likely, and selling pressure will significantly increase. The only support area below this is at 1.355.
✅ If the price manages to break the resistance at 12.610, the potential for an uptrend increases. The next resistances are at 19.426 and 44.596. The major resistance near the ATH is at 161.591.
📅 Daily Time Frame
In the daily time frame, we can observe the price behavior in more detail. As you can see, there is a descending trend line that has been driving the price downward after reaching a high of 9.534, starting as a correction but turning into a downward movement due to the volume of sales.
🔽 If support at 5.439 is broken, it confirms the end of the uptrend, and the price will return to the box between 4.306 and 5.439. If support at 4.306 is broken, the situation will worsen for AXS as, as seen in the weekly frame, there is no significant support until 1.355.
🧩 Conversely, if the price can regain upward momentum and buying volume enters the market, we can expect the price to rise. The first significant trigger is the breaking of the descending trend line, which could introduce momentum into the market. Breaking above the 50 area in RSI could also assist in this upward movement.
📈The main trigger for a price increase is breaking through 7.366, a risky move, with primary buying triggers at the resistances of 9.534 and 12.610.
📝 Final Thoughts
This analysis reflects our opinions and is not financial advice.
Share your thoughts in the comments, and don’t forget to share this analysis with your friends! ❤️

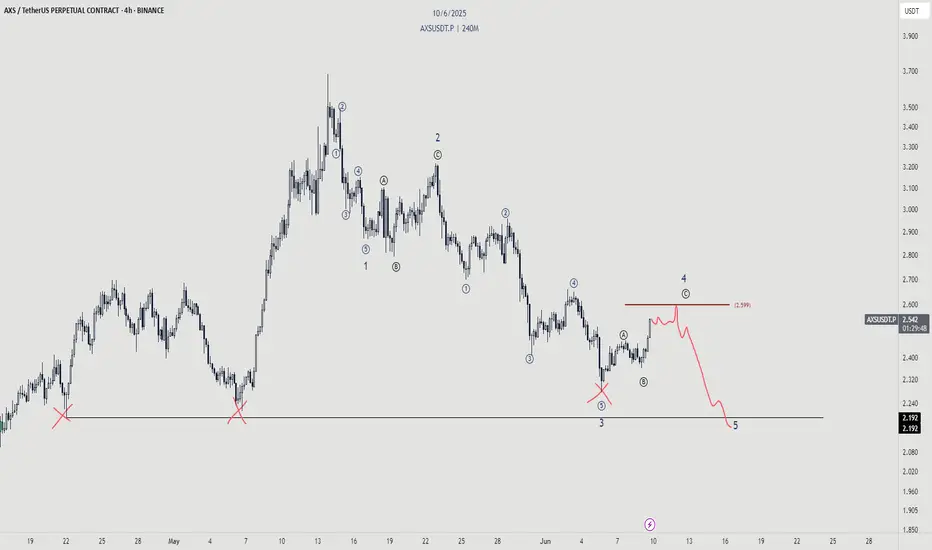
AXS/USD Macro Sentiment Trend (with price targets)Good morning!
Marked up this chart with a potential Elliott Wave count. Key question: is wave C complete? Let's hear your views!

AXSUSDT 6DAXS ~ 6D
#AXS Retesting this support would be a very good buying place for now,. Buy in stages with a minimum target of 20%+

Axie Infinity (AXS)🎯 Introduction
AXS (Axie Infinity Shards) is the native token of the Axie Infinity ecosystem, a popular blockchain-based game operating on the "Play-to-Earn" model. Players can earn AXS tokens by breeding, battling, and trading digital creatures known as "Axies." This token is also used in governance mechanisms, staking, and in-game transactions. The growth in AXS’s value is tied to the ongoing development of the game and its wider adoption within the cryptocurrency world.
📊 AXS Technical Analysis
Current Status:
On the weekly timeframe, AXS is in a long-term range-bound zone:
📈 Range High: Red zone (11.186 - 12.605)
📉 Range Low: Gray zone (3.840 - 4.414)
Key Support and Resistance Zones:
Daily Support: Purple zone (5.581 - 5.932)
This zone has acted as a key support level. If lost, the price is likely to fall toward the lower range (gray zone).
Daily Resistance: Yellow zone (6.910 - 7.328)
Breaking through this level could trigger a price move towards the range high (red zone).
Upcoming Scenarios:
🟢 Bullish Scenario:
If the purple support zone holds and the yellow resistance is broken:
Move towards the range high (red zone).
A breakout above the red zone will lead to price targets based on Fibonacci levels:
🎯 TP1: 20.007 - 24.056
🎯 TP2: 41.929 - 48.315
🎯 TP3: 67.896 - 77.108
Important Note: At each of these targets, profit-taking 💵 is strongly advised.
🔴 Bearish Scenario:
If the purple support zone is lost, the price may drop towards the lower range (gray zone).
🎯 Suggested Entry Points:
Break above the daily yellow resistance with a stop loss below the gray zone.
Break above the red resistance with a stop loss below the purple zone.
Indicators and Volume:
RSI:
Crossing above the midpoint of the RSI may indicate a bullish move.
Entering the Overbought region could lead to sharp upward movements 🚀.
📊 Volume Analysis:
Increased volume during resistance breaks is crucial; otherwise, there’s a higher risk of false breakouts.
📌 Summary:
AXS is currently at a critical level. Price behavior in relation to the identified support and resistance zones will determine the future trend. Effective risk management through stop-loss and close monitoring of trading volume are key to success in trading this coin. 💡
Recommendation: Always consider the overall market conditions and any related news regarding the Axie Infinity project before making trading decisions.

AXS-4h- Accumulation RangeAXS-4h- Accumulation Range
REMEMBER that a lot of investors sell stocks or crypto for fiscal conditions in 2024 to close the year.
For that, we have low buy liquidity , and even with that pressure on the price , AXS is trying to remaning in the same range as 1 week ago, so a breakout can restart a new HH , so patience.
Im bullish on AXS if 7.0 will be broken and confirmed as support.

#AXS (SPOT-INVEST) IN (4.500- 6.300) T.(60) SL(4.269)BINANCE:AXSUSDT
#AXS / USDT
Entry ( 4.500- 6.300)
SL 3D candle close below 4.269
T1 10.000
T2 22.000
T3 37.000
T4 44.000
T5 60.000
3 Extra Targets(optional) in chart, if you like to continue in the trade with making stoploss very high.
______________________________________________________________
Golden Advices.
********************
* collect the coin slowly in the entry range.
* Please calculate your losses before the entry.
* Do not enter any trade you find it not suitable for you.
* No FOMO - No Rush , it is a long journey.
Useful Tags.
****************
My total posts
www.tradingview.com
1Million Journey
www.tradingview.com
www.tradingview.com
**********************************************************************************************
#Manta #OMNI #DYM #AI #IO #XAI #ACE #NFP #RAD #WLD #ORDI #BLUR #SUI #VOXEL #AEVO #VITE #APE #RDNT #FLUX #NMR #VANRY #TRB #HBAR #DGB #XEC #ERN #ALT #IO #ACA #HIVE #ASTR #ARDR #PIXEL #LTO #AERGO #SCRT #ATA #HOOK #FLOW #KSM #HFT #MINA #DATA #SC #JOE #RDNT #IQ #CFX #BICO #CTSI #KMD #FXS #DEGO #FORTH #AST #PORTAL #CYBER #RIF #ENJ #ZIL #APT #GALA #STEEM #ONE #LINK #NTRN #COTI #RENDER #ICX #IMX #ALICE #PYR #PORTAL #GRT #GMT #IDEX #NEAR #ICP #ETH #QTUM #VET #QNT #API3 #BURGER #MOVR #SKL #BAND #ETHFI #SAND #IOTX #T #GTC #PDA #GMX #REZ #DUSK #BNX #SPELL #POWR #JOE #TIA #TFUEL #HOT #AVAX #WAXP #OGN #AXS

#AXS/USDT#AXS
The price is moving in a descending channel on the 1-hour frame and is expected to continue upwards
We have a trend to stabilize above the moving average 100 again
We have a descending trend on the RSI indicator that supports the rise by breaking it upwards
We have a support area at the lower limit of the channel at a price of 6.71
Entry price 6.73
First target 6.90
Second target 7.06
Third target 7.20

FREE SIGNALHello guys
After the bottoming, this coin was able to hit its weekly resistance, and now, considering the pullback it has made, it is a good time to buy it for the goals we specified for you.
Be successful and profitable.

axsWell, first, it has a resistance in the red box and I'm waiting to see if it wants to return to the blue lines. In the second stage, we have two more lines that still keep us in the yellow box. After that, if we want to get out of the box, the numbers above will be activated. It's a good option. You can watch its movements.
#AXS (SPOT) entry range(4.170- 5.150) T.(9.190) SL(4.096)BINANCE:AXSUSDT
entry range (4.170- 5.150)
Target1 (6.660) - Target2 (8.370)- Target3 (9.190)
1 Extra Targets(optional) in chart, if you like to continue in the trade with making stoploss very high.
SL .1D close below (4.096)
*** collect the coin slowly in the entry range ***
*** No FOMO - No Rush , it is a long journey ***
**** #Manta ,#OMNI, #DYM, #AI, #IO, #XAI , #ACE #NFP #RAD #WLD #ORDI #BLUR #SUI #Voxel #AEVO #VITE #APE #RDNT #FLUX #NMR #VANRY #TRB #HBAR #DGB #XEC #ERN #ALT #IO #ACA #HIVE #ASTR #ARDR #PIXEL #LTO #AERGO #SCRT #ATA #HOOK #FLOW #KSM #HFT #MINA #DATA #SC #JOE #RDNT #IQ #CFX #BICO #CTSI #KMD #FXS #DEGO #FORTH # AST #PORTAL #CYBER #CLV #RIF ENJ #ZIL #APT #MAV #ZRX #ID #AXS ****

#AXSUSDT #1D (Bybit) Big falling wedge breakoutAxie Infinity regained 50MA support after a long downtrend, looks ready for mid-term recovery towards 200MA resistance.
⚡️⚡️ #AXS/USDT ⚡️⚡️
Exchanges: ByBit USDT
Signal Type: Regular (Long)
Leverage: Isolated (2.0X)
Amount: 4.6%
Current Price:
5.202
Entry Targets:
1) 4.854
Take-Profit Targets:
1) 6.947
Stop Targets:
1) 3.805
Published By: @Zblaba
NYSE:AXS BYBIT:AXSUSDT.P #Axie #NFT #P2E axieinfinity.com
Risk/Reward= 1:2.0
Expected Profit= +86.2%
Possible Loss= -43.2%
Estimated Gaintime= 1-2 months
