AXS looks juicy for a pumpAXS looks juicy for a pump, we are sitting in good areas, if AXS flips get ready to long it!
AXS

AXS UPDATEIn Axs, I went to update the measurements of wavelengths in my previous drawing, based on this, I updated the 5-fold drop of the z wave again.

AXS will go against the market!Hello, everyone!
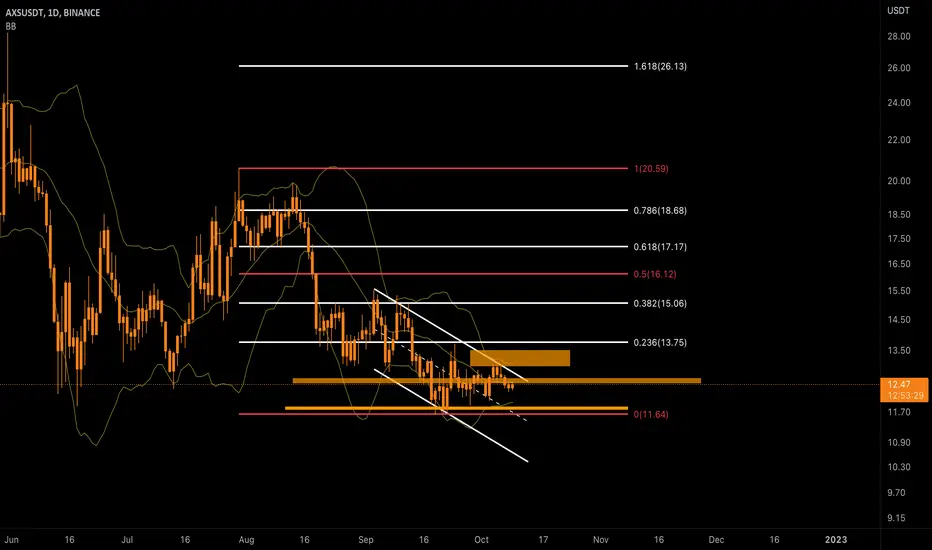
Recently I showed you the very low targets for altcoins and the Bitcoin. Today I wanna show you the asset which is very closed to it’s bear market bottom. Axie Infinity have the unique wave structure and have already reached the very important level.
On the 1D timeframe of the AXSUSDT chart we can see that AXS started it’s last bearish global wave earlier than Bitcoin and other coins. Thus it has formed the wave 2 earlier and we can measure the target for the wave 3. If you remember on the other altcoins the wave 3 reached 1.61 Fibonacci, the classical target. On the AXS wave 3 is extended and reached almost exactly 2.61 level. Now I anticipate the corrective wave 4.
Taking into account the fact that wave 2 retraced too much, almost hit the wave 1 start, wave 4 should retrace no more than 0.38 Fibonacci, approximately $12.6. Anyway it is not forbidden for AXS to reach 0.61 Fibonacci level and retest the broken trendline, but in my opinion it looks fantastic. After wave 4 I expect the trimmed wave 5 because wave 3 was extended. I will make an update when will be time to buy. Now you can trade Axie only locally with the target $12. If you are not satisfied with such potential reward – just skip this trade.
Best regards, Ivan

🔥AXIE INFINITY unlock 21.5M coins: almost 100% profitable trade🔥 Hi friends! A few days ago AXIE start to unlock the coins for it's early investors. 21.5M coins that worth almost $200M flow into exchange to SELL but as we can see there is no huge DUMP as 99% of traders expect. On the contrary, price start to grow with entire crypto market.
✅ I think this event misslead the last AXS holdlers which sold their coins before the event. Of course, the BIG PLAYERS accumulate all these volume.
📊 The main reasons/preconditions to open a long:
🔥 the first trigger is the no DUMP despite the bearish event with coins unlock
🔥 a lot of short traders which become the fuel for growth
🔥 squeeze to the trendline+volume growth before the trendline breakout
🔥 bullish BTC
📊 The main targets for AXIE:
1. $11.3 - the key level
2. $12.2-13 - the value area
2. $13.8-14.8 - the value area
✅ Why I set so BIG targets?
All the crypto market in the bear market for the last 1 year, a lot of short traders open their positions then and now before this event. I think they might become the FUEL🔥 for this growth and PUMP the price so hard because of short liquidations.
🚩 Traders, book the profit by parts and don't forget to spend this money on your education, relax, trips or on family. Trading is for making money and not about sitting in front of the screen 24/7.
💻Friends, press the "boost"🚀 button, write comments and share with your friends - it will be the best THANK YOU.
P.S. Personally, I open an entry if the price shows it according to my strategy.
Always do your analysis before making a trade.

Short AXS
AXS is one of the first and the biggest play-to-earn cryptos.
Will it come back to where it'd started its rally last year to made x30 times in just a few months?
AXS is loosing its long-term weekly trendline. Although we will need some days to confirm this break-down but we can short AXS here because in 2D TF, AXS's already broken the local trendline.
Moreover, the MFI has also broken the trendline showing that buyer's sentiment is no longer good to prevent it falling more.

axs coin more dump comming?AXS/USDT 4h time frame update :-
AXS Coin currently trade around 8.7$. (Under high pressure) cauze some bad news about axie infinity projects.
Till 25 october we are in bearish mood on axs coin but high volitily expected under this project so some small trade possible.
Like took trade below 8.5$ for some quick profite.
And 2nd trade took below 8$.
Before 25 october don't buy it in spot trade do trade with proper risk management⚠
follow me for more updates.
Remining things i update you time by time🙃

AXS H4 BULLISH WAVE COUNT SCENARIOThis is a bullish wave recount scenario for AXS (previous count has been invalidated); this analysis is void if price managed to break and closed below the INVALIDATION LINE. Wave C is expected to settle around the 50 - 61.8 Fibonnaci area. Trade at your own risk NFA.

AXIES DUMP INFINITY PONZI COLLAPSEAxie Infinity is a pyramid scheme collapsing.
That's a Ponzi in the collapse phase. Their Smooth Love Potion token is down 90% and in a screaming dive, and their Axie token is down more than 90% from peak. That one is going to hurt a lot of poor people in the Philippines. Many quit their jobs to play Axie's play-to-earn game. All the money comes from later entrants, so it's a Ponzi by definition.
Stay safe

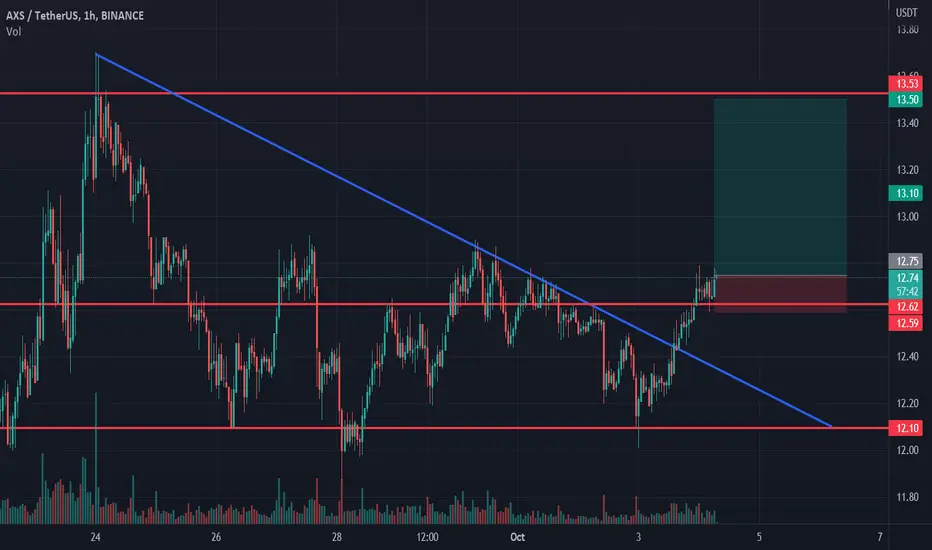
AXS - AnalysisAXS had a range trend over the past week. The currency's price is hovering in the support zone of $12.5 for the third week, and the short-term descending channel intended for it is still standing. The ceiling of this descending channel in the resistance range of 13-13.5 dollars can still be accompanied by a reaction. For the short term, if the minor resistance in the range of $12.50-$12.65 is broken to the upside, and the 4-hour candles stabilize above this area, we can expect the price to break out of the descending channel.
Otherwise, the further price reduction can continue up to the support range of $11.8. If the ceiling of the descending channel breaks above the specified resistance range, the first target of buyers can be considered in the resistance range of $13.7-14. The second target is the resistance of $15, which can be associated with a negative reaction.
AXIE (AXS) BULLISH WAVE COUNTThis is a bullish wave count scenario for AXS; this analysis is void if price managed to break and closed below the INVALIDATION LINE. Wave C is expected to settle around the 50 - 61.8 Fibonnaci area. Trade at your own risk NFA.

AXS/USDT - SHORT----- Welcome, dear followers! -----
- Here is my trading methodology. I trade with a normal system and analysis of resistance and support, as well as price reversal patterns.
- For the record, I do not place a stop loss within my trades. So that I only risk 1.5% of my total capital in order to support the loss due to a price reversal against me.
- If a price reversed against my expectation and touched the drawn line r3, then I transferred targets to the entry point and waited for the price to close at it with a loss equal to almost zero.
- Today's deal is shown in the chart, and here are the entry and exit points below.
-- Support me with numbers and follow up on my account for other deals in the future. Thank you for coming to this part. --
-------------------------------------------------------
⚡️⚡️ AXS/USDT ⚡️⚡️
Exchange: Binance Futures
Trade Type: Regular (Short)
Leverage: Cross (1.0X)
Entry Orders:
1) 12.4 - 100.0% (62 USDT)
Take-Profit Orders:
1) 12.15 - 80.0%
2) 11.88 - 19.999%
Trailing Configuration:
Stop: Breakeven -
Trigger: Target (1)

Axie Infinity longAxie Infinity broke trough the descending trendline. Asset broke trough the resistance level. Bullish movement to resistance level at 13.5 is expected to happen.
Is AXS about to finish his bearish trend?Even I checked multiple high timeframes I just saw too much important support and resistances near to current zone, but bearish flag pattern is not finished yet which makes me doubt about if bearish trend will finish soon or not, so I think that I need to check closely BOS and CHoCH in order to confirm. Also we can see in chart that squeeze momentum is pointing to bullish.

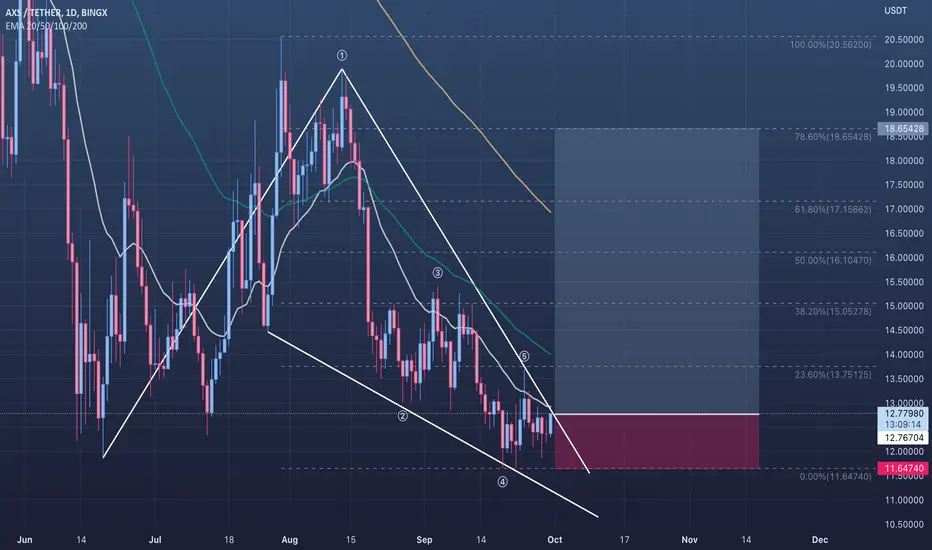
🟢 AXSUSDT - 1D (30.09.2022)🟢 AXSUSDT
TF: 1D
Side: Long
Pattern: Bull Flag / Falling Wedge
SL: $11.64740
TP 1: $13.75125
TP 2: $15.05278
TP 3: $16.10470
Nice bull flag / falling wedge on AXSUSDT.
Should be looking to break out soon.
Buy now and DCA or wait for price to reach the red area.
🚩🔥 My favourite trading pattern: Axie trendline breakout!📊 Hi friends! AXS moving in a massive falling wedge. Now the price is close to the global trendline. The squeeze to the global trendline confirms us the pressence of buyer. This is a good place to open a long with nice RR.
Every time when the price reach the bottom, the volume bars are growing which mean the pressence of buyers. They want to buy the altcoins lower to sell at higher price.
📊 I see the next preconditions to open a long:
🚩 squeeze to the trendline before the breakout
🚩 DOM and Footprint orders to buy as the support of the price
🚩 BTC push the price of the Axie to the our targets✅
🔥 It would be nice to see the price breakout of the key level of $12. Addtionally the volume should grow and confirm this trap.
✅ The targets:
1. $14-14.5
2. $18-18.5
💻Friends, press the "boost"🚀 button, write comments and share with your friends - it will be the best THANK YOU.
P.S. Personally, I open an entry if the price shows it according to my strategy.
Always do your analysis before making a trade.

Games of Capital Rotation, example with $ATOM and $AXS$AXS was a coin that hit peak hype and coincidentally has some of the worst tokenomics. $ATOM on the other hand _might_ be forming to be a winner in the next cycle. Simple pair trade, shorting the past hype, longing the future hype and avoiding the crab bites. Similar to SAMA Long below ( + $SOL , $MANA)

#AXSUSDT#AXSUSDT
If axs can break down the trend line ( red line ), next target will be 20$ .
and if stay bellow this trend 12$ is next support

🔥AXS make a huge pullback: where to entry to not miss the PUMP?Hi friends! I give you 1 useful tip to increase your trading results. Always pay atention to the volumes growth. It will help you to identify the potential reversal points, where you open the bes trades with good sl and tp.
Check the last 2 traps that happen on AXS. Do you see how the volume growth on the both traps (false breakouts) for short and long? There are the best setups for the scalpers and swing trading. Pay the atention to such situations close to the important levels, huge value areas.
📊 Preconditions to open a long:
🔥 squeeze to the trendline
🔥 no resistance on DOM and Footprint only big buy orders. Also if u use such tools you can see how thw large sell limit waals are desapear beacause of huge amount of buyers
🔥 bullish BTC help the AXS to reach the 3 targets faster
🚩 It will be nice to not have the volume growth when the price reach cosest targets and resistance. It will be some bearish signals. If the we will have just avsarage volumes, that is mean the big players are still not sell all their coins.
📊 The targets for long:
1. $15 - the key level, closest target
2. $18-19 - the closest value area
3. $20-21.5 - the value area
💻Friends, press the "boost"🚀 button, write comments and share with your friends - it will be the best THANK YOU.
P.S. Personally, I open an entry if the price shows it according to my strategy.
Always do your analysis before making a trade.

bullish on AXSI have just happened to see this channel on axis and it seems very nice. this is a place where I would look for entries for a swing position.

AXS - I'd wait a little bit longerThe breakout of the wedge is ahead - for both low and high timeframe - but before we break out, Momenter is signalling a rising bearish momentum which would make sense as to finally hit the $11 area which is a strong support - price didn't touch it yet and it would be a pretty good area to long - Keep your eyes on it. If we break out to the upside, 28-30$ is an easy reach if BTC bounces aswell.

Axie Infinity (AXS); when to buy?The resistance level with the upper border of $15.02 was broken on the Daily price chart on September 3. The trend is bullish now and the correction wave develops.
A pullback buying opportunity will appear after the correction completion on the Daily timeframe.
The highs of September 3 – 5 will be the target for the bullish movement continuation after the correction is finished.
In case of successful development of the trend, a more distant target will be on the highs of August 12 – 15, where the next resistance is located with the borders of $19.23 – $19,90.
Long positions will remain relevant until the market is above the nearest support level on the Daily timeframe, the lows of August 26 – 30 . The borders of this support are $13.0 – $13.15.

SWFTC SwftCoin low market cap Swap listed on Coinbase !SWFTC SwftCoin is i think thelowest market cap coins listed on Coinbase.
It has a market cap of only $6.21 Mil.
At this level, low float and tight order book, a small pump could skyrocket SWFTC to 10X!
SWFT Blockchain is a cross-chain swap aggregator that combines blockchain and artificial intelligence technology to provide support for all major public chains, and hundreds of cryptocurrencies, as well as mainstream NFT trading platforms and mainstream NFT projects.
So SWFTC is a swap, like Uniswap ($4,78Bil mk cap), Pancakeswap ($577Mil mk cap) Anyswap ($95Mil mk cap), while SWFTC has a mk cap of only $6.21Mil.
It is now trading at only $0.001551, but at its peak it was $0.09186.
So i believe the 10X is reasonable from here.
Looking forward to read your opinion about it.

DAY 3: #AXSUSDT #LONGDAY 3: #AXSUSDT #LONG
2% of the deposit
Margin: isolated
⚖️Leverage: x10-20
🗝Entry point: 14.00-14.12
🎯target 1 - 14.39
🎯target 2 - 14.67
🎯target 3 - 15.08
🎯target 4 - 15.53
🎯target 5 - 16.09
❌stoploss: 13.50
