AXS (Axie Infinity Shards) - AnalysisHello to all members of TradingView and my followers.
AXS is still on a downtrend; this is the ninth week in a row that candles have been recorded on the chart. The price is falling again towards the lower support, reacting to its resistance in the range of $ 23. The first support is $ 16.85, and the main support is $ 9.86 to $ 14.4, which is expected to hit the second support due to the high pressure of the downtrend. This support is for weekly timeframes, a full reversal, and the start of a new uptrend. The price can even drop to $ 10.
Even if the bearish line is broken, we expect a bearish trend between the weekly support and the $ 25 resistance in the medium term. The Ichimoku indicator in the daily timeframe has not yet issued a signal of price growth. It only indicates that the first support is the range associated with the reaction. But in the 4-hour timeframe, if we see a return above $ 18.5, I expect the price to rise to around $ 21.
If it is helpful to you, please like it. If you have a comment, I'll be happy to know. Respectfully.
AXS

AXS - Someone is collecting a big positionReasons to take short
⭐️ We are in a bear trend
⭐️ Level is clean
⭐️ Level is 13 days old
⭐️ Volume at top
⭐️ Pullbacks are getting smaller
⭐️ Trading near the level for a couple days
⭐️ 4th touch
⭐️ 40 ATR
Will enter when price squeezes to the level on 5m timeframe, the base will form and the strip will get faster.
If you don't understand the previous sentence, just use swing stop-loss 3-5%
Fix profit by parts:
1% - 1/3
2% - 1/3, stoploss to breakeven
What's left, hold to the maximum
What do you think of this idea? What is your opinion? Share it in the comments📄🖌
If you like the idea, please give it a like. This is the best "Thank you!" for the author 😊
P.S. Always do your own analysis before a trade. Put a stop loss. Fix profit in parts. Withdraw profits in fiat and reward yourself and your loved ones

AXS - Example how one candle can change direction of a tradeFollowing my last idea on AXS, where I wanted to short this formation, now I am looking to long it because of the candle down with wich marketmaker collected liquidity.
Will enter when price squeezes to the trendline on 5m timeframe, the base will form and the tape will get faster.
If you don't understand the previous sentence, just use swing stop-loss 3-5%
Fix profit by parts:
1% - 1/3
2% - 1/3, stoploss to breakeven
What's left, hold to the maximum
What do you think of this idea? What is your opinion? Share it in the comments📄🖌
If you like the idea, please give it a like. This is the best "Thank you!" for the author 😊
P.S. Always do your own analysis before a trade. Put a stop loss. Fix profit in parts. Withdraw profits in fiat and reward yourself and your loved ones

Axie Infinity AXS Entry Range, Take Profits and Stop LossAXS/USDT short
Entry Range: $18.70 - 20.20
Price Target 1: $17.90
Price Target 2: $16.50
Price Target 3: $10.50
Stop Loss: $23.50

AXS will continue to fall -40%🔥Subscribe to the channel, get notifications about signals!🔥
#AXS
▪️AXS will continue to fall, the next stop is -40% to the deposit.
💎The market is in a downtrend, there are no prerequisites for growth yet, let's be realistic.

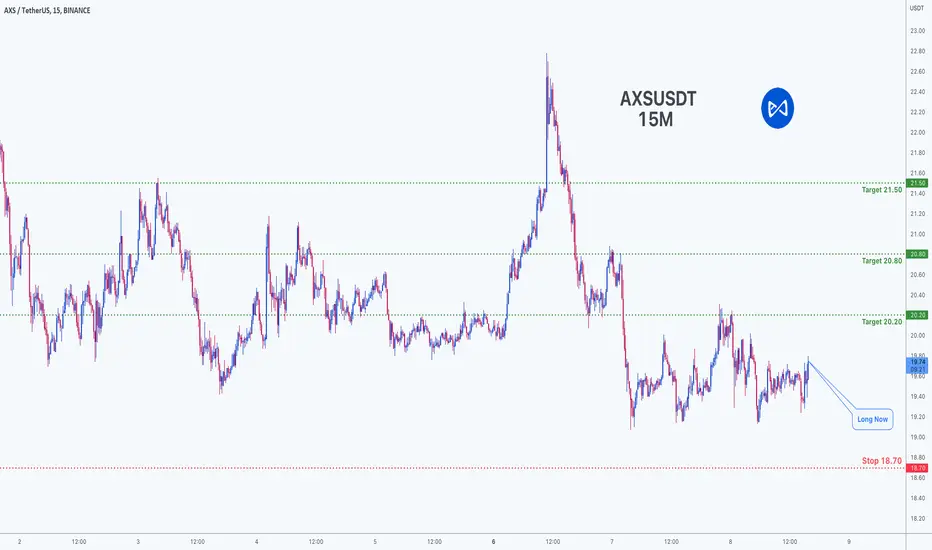
Trading opportunity for AXSUSDT Axie InfinityBased on technical factors there is a long position in :
📊 AXSUSDT Axie Infinity
🔵 Long Now 19.75
🧯 Stop loss 18.70
🏹 Target 1 20.20
🏹 Target 2 20.80
🏹 Target 3 21.50
💸Capital : 1%
We hope it is profitable for you ❤️
Please support our activity with your likes👍 and comments📝
AXS - Hit targets and gain good profitBINANCE:AXSUSDT
1 Hour chart
-
AXS did perform well and make sure you take profit with following the buying strategy as below(shared on June 6)
Congrats and don't forget to close position at every TP level anytime.

AXS - Buying signalBINANCE:AXSUSDT
1 Hour chart
-
AXS is accumulating volume and squeezing candles for a while.
It is getting resistance from downtrend, and approaching to the downtrend again.
If 1H candle can take out the downtrend, it'll be good timing to open long and have nice risk/reward ratio here.
-
Targets:
1) 20.63-----blue horizontal ray.
2) 21.19-----Fib 1
3) 21.66~21.85-----Fib 1.272~1.382
Stop loss:
1) 19.76-----red horizontal ray

AXS falling wedgeJust classic TA, falling wedge breakout with TP at 31.8 and 45.2.
RSI already brokeout of its descending trendline and has printing bullish divergences.

AXS : Bullish movement ahead?AXS / H4 / Log chart
AXS is bouncing from the double bottom support and if AXS Breaks the red downtrend line, I am expecting AXS To reach the Red zone.

✅GMT: will the Axie pattern repeat or GMT is a SCAM?Hi friends!
As we all know the 👟GMT fall close to the $1 key level because of 2 main reasons:
1️⃣ a lot of game tockens were minted. Green Satoshi Token (GST) is a gaming token of Stepn APP:
🔶GST supply on May 21 was 3.58M.
🔶GST supply is 52.9M now .
The supply increased by 1477%, which is a lot and led to a fall in the price of Stepn itself.
2️⃣ China start blocking the Stepn app on July 15. This happen due to the regulation of cryptocurrencies in the country. Naturally, this caused panic among the Chinese, massive sales and collapsed the price of the cryptocurrency by 26%. Recall that the Chinese are the main part of players in the app.
Axie and Stepn have fallen similarly after Bitcoin's fall, but will GMT repeat the AXS pattern of 2021? It would be ideal to wait for a similar trend line and open a long on a breakout. After the 80% drop, when reatail is scared and squeezed under the trend line, it would be possible to open a similar to AXS long.
📊Let's compare this two games:
1. There are actually a lot of people playing in Axie Infinity. There's a developed ecosystem, it's more than a few years old, the game is constantly evolving.
2. GMT looks like a pyramid scheme and it might scam at any time.
Friends, if you want to trade, please use the stop losses, because this is the main thing in trading that allow you to be succesfull for a long long time.
If GMT repeats the AXIE pattern, I will be posting trading setups in new updates and ideas, so stay tuned!
💻Press the "like"👍 button, write comments and share with your friends - it will be the best THANK YOU.
P.S. Personally, I open an entry if the price shows it according to my strategy.
Always do your analysis before making a trade.

AXS - Market is NOT Looking good atmAXS is one of the charts that keep us worried about the next hours/days as the prices have failed to have a proper rebound and are close to check again some of their key support levels.
That level for AXIE is the 19.99 (call it 20$) mark.
If that breaks then technically the next support is way lower at 13.8$
Scary.. be on Alert as the market might take another dive. Always advisable to have some short positions on and ours right now is on AXS..Just like with Luna:
We are not saying that AXS will go to zero but we ARE saying it can go to 14$ if it loses the 20$
Always hedge.
One Love,
the FXPROFESSOR

🔥AXS: is Axie still bullish? Wait for this scenario!Is it possible that Axie will return to its ATH? This game-fi project is returning its popularity and in this idea I will explain when to enter to the local long trade, what to pay attention to and outline the targets.
✅The first thing to do is to wait for a false breakdown of the key levels of $19.75 and $19.25. I have not marked them on the chart, but you can mark them for yourself.
Why these levels? On the horizontal volumes, I see that a lot of trades were made at these levels, therefore under these key levels is a large number of stop-loss traders!
✅Secondly, the growth of volumes will show us:
liquidation of long traders
purchases of a big player, which will help us to identify the end of a falling move.
✅Thirdly, the return and modification under the local trend line. The more traders will take short trades on this fall, the higher will be the Axi rise. Short traders will be the fuel🔥 for growth.
By combining these 3 tips together, you can open a successful long with a short stop loss and a high chance of success.
The targets for long :
1. $25.50-27 value zone.
2. $29-29.60 value zone
💻Friends, press the "like"👍 button, write comments and share with your friends - it will be the best THANK YOU.
P.S. Personally, I open an entry if the price shows it according to my strategy.
Always do your analysis before making a trade.

AXS is gonna Reach 3$ (or is it?)AXS is in a Rounded Top. The Price is in Big Trouble,because The Price Is in a BIG bearish Pattern (Weekly Time Frame) .The Price can Decrease as Much as The Length Between the Top and the Bottom of the rounded top and fall to 3$. BUT there is a Regular Bullish Divergence on MACD which will Make Us doubt This Movement. There is a Slight Chance that the Price would Obey this Divergence Instead of the Pattern which We Talked about. So we Can also Rely on a Bullish Scenario as well. But The Break out MUST Happen which is gonna Take a week or two for Us to come to a Conclusion about This.
-AXS is in a Rounded top
-The Price can Fall to 3$
-Weekly Timeframe
-(+RD) On MACD
-The Price Might Become Bullish.
-wait a week or two For a Conclusion.
_ _ _ _ _ _ _ _ _ _ _ _ _ _ _ _ _ _ _ _ _ _ _ _ _ _ _ _ _ _ _ _ _
Thank you for seeing idea .
Have a nice day and Good luck

#AXS/USDT 2HOUR UPDATE BY CRYPTOSANDRS !!Hello, members welcome to AXS/USDT 2hr chart update by CRYPTOSANDERS.
I have tried my best to bring the best possible outcome in this chart.
As we can see from the above-mentioned chart the AXS/USDT brack the inverse head and shoulder pattern create and broke the neckline and retested the green zone and the current scenario we are expecting that get will go up all the way to $38.32 means almost 70%.
So if it moves to the green zone again then it will be the zone to go long on AXS/USDT
entry:-$21.10 , $22.30
target:-70%
stop-loss:-$19.60
with leverage 5x to 10x
Sorry for my English it is not my native language.
Remember:-This is not a piece of financial advice. All investment made by me is at my own risk and I am held responsible for my own profit and losses. So, do your own research before investing in this trade.
Do hit the like button if you like it and share your charts in the comments section.
Thank you.

Long AXS bull flag Very negative funding and bull flag appears to have retested and can now be sent flying

Short-term Trading Tricks on AXS Metaverse TokenBINANCE:AXSUSDT
Good evening Indonesian time everyone. I hope all of us are happy, tonight I want to share an analysis regarding the $AXS token, based on analysts, the AXS token will continue to decline until 23.15 Western Indonesian Time, after that we make a purchase and set it to take profit of 1.5% to 1.5%. 2%. because tomorrow will probably be around 9-10 pm western Indonesian time, there is a possibility that $AXS will drop back to at least $20.

AXIE - Short Set-UpAXIE INFINITY chart update and still not convinced we could se a serious Pump here yet.
On the contrary, this is a textbook definition of a short, unless the markets can push it higher over 22.45 where it can find support.
Until then, we are short.
One Love,
the FXPROFESSOR

AXS- Off Balance and ScaryAXIE Infinity chart is off balance as the price is now flirting with as low as 13.8$
Scary... given that it has just lost the 20$ psychological mark as well.
Time to be really careful again here.
One Love,
the FXPROFESSOR

F#%k the system, Axie!An Axie is a small, smart creature and likes to f#%k the system, hence price will rocket, no matter what Bitcoin and Nasdaq do!

AXIEinfinityAXS/USDT have strong Resistence if dont break Resistence i see this price will drop around 13-15$

💂🏻CryptoSoldier💂🏻: BUY AXSBINANCE:AXSUSDT
📈 Spot Trade: BUY AXS
⚠️ SL: -
🏅 TP: - In Image
⏳ Time aprox: 7~10 dias
💂🏻If you agree this Trade hit the like button.
💂🏻Si estas de acuerdo deja tu like.

AXS - UPDATED CHARTSupport at 20$, Resistance at 23$ and once/if over then off to 29$- this is the most likely scenario...that means that the market helps.
If the situation does not help then we have a clear entry for a short at 19$ all the way down to 13,8$.. this is the unlikely scenario but still it exists.
News:
Binance CEO Says Axie Infinity Handled Its Crisis Better Than Terra With UST Depeg
In a Twitter thread, the Binance boss shared his disappointment in how Terraform Labs team handled its ecosystem’s collapse.
One Love,
the FXPROFESSOR
