AXSUSDT - SETUPAXSUSDT price has shown weakness at LTF after breaking the symmetrical triangle. If Bears contains the momentum we can expect a LL once as the Price is already trading below EMA 21. Price hit the strong resistance zone which may irritate the BULLS again and again. So selling on strength will be a strategy until bullish indications.
AXS

axsaiming for that 3.3. big big liquidity pool on axs. it should give a retest for now, can give a couple. with good fundamentals this will be a best buy at 3.3. so many fvgs at low levels too

AXS/USDT Wycoff AccumulationAXS/USDT
🟢entry: $47.660- $44.495
❌stoploss: $39.400
🎯tp1: $124.605
🔼potential %profit: +161.45%
🔽potential %loss: -17.33%
r/r: 9.32
Hi Everyone,
🧩AXS appears to be undergoing Wycoff Accumulation. During Phase A, we saw a -52% mark-down with moderate volume to Preliminary Support (PS) and a -67% mark-down to Selling Climax (SC) with moderate-high volume. After establishing a tight range for 2 weeks after SC, an automatic rally began with high volume.
🧩After the first AR, Phase B began, establishing a much larger trading range. Within Phase B, we see 2 Spring Tests (ST) with moderate-low volume. Following the second ST, there was another large AR with high volume. Beginning with the second AR and through today’s date, we see sustained moderate-high volume, especially compared to the previous trading volumes. This can be interpreted as large operators fully committing to large-scale accumulation.
🧩As price is currently at the bottom of the trading range, it is probable that we are coming to the end of accumulation by large operators and will see one last ST to establish the final shake-out before a mark up to begin Phase D.
🧩Based on this analysis, I am entering a swing long. I will enter at the bottom of the trading range and patiently hold the position, watching for price to demonstrate LPS and SOS to confirm my analysis. I will sell half of the position in the annotated range of anticipated distribution and keep half the position to be placed as price establishes the actual distribution range.
Check back for updates as the position progresses.
Feedback and constructive criticism is always appreciated.
✌️All good luck and always practice strict risk management!

AXS Hacked - No more players means the Ponzi is over - CollapseThe collapse of AXS after $600M hack and all funds stolen. Funds were sent into Tornado Cash. After multiple cycles it is so hard to trace. Most crypto was withdrawn in exchanges in countries the US can not extradite.
People have stopped playing as players can not withdraw funds. Players in PH have stopped coming to work. SLP is worth almost nothing so there is no incentive to play.
Only a matter of time before it collapses to nothing. The ponzi is over
www.vice.com

AXS AT $29. IS THE FALL OVER?What a a fall?
Axs has seen a real fall.
Lesson:
Never your you FOMO (fear of missing out) in cryptocurrency. Axs was at $160 not too long and it is now at $29.
Share your thoughts, like , comment and follow.
I am bullish long term.
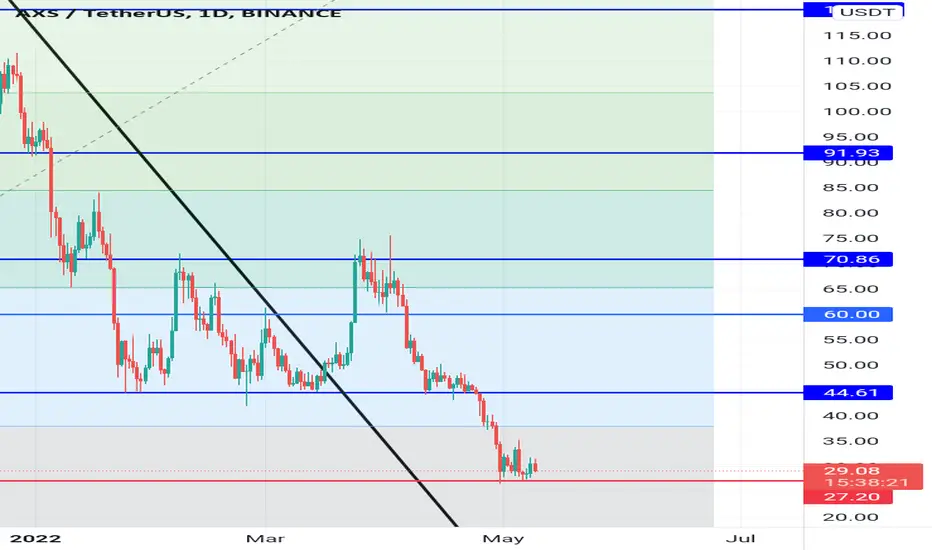
AXS cryptocurrency - counter-trend trade with a target of $43Everyone who had the opportunity to watch the online growth of the cryptocurrency AXS in the period from June to October 2021 is now shocked. The gaming token, which grew uncorrected and ignored the local waves of bitcoin decline, is n ow one of the weakest . The global prospect of falling AXS is great.
We believe that the price of AXSUSDT may fall to the range of $19-21. The main question is whether sellers will be able to realize such a fall without deep rebounds.
The global breakthrough of the initiative on the cryptocurrency AXS occurred after the breakdown of the $43 range . All this happened without increased trading volumes, which confirmed the need for cryptocurrency now. If we analyze the trading volumes not only on the Whitebit exchange (according to the charts of which we are now analyzing) but also on other exchanges - it becomes clear that trading volumes began to grow in late April 2022.
Of course, these trading volumes are not equal to July 2021 . As a result, a consolidation in the range of $27-35 was formed. These facts suggest that the sellers do not have enough strength to continue to fall without correction. In addition, the price of BTC also came at a critical moment, from which buyers still have a chance to organize a local wave of growth.
Analyzing the graph of USDT dominance, we see that the figure is at historical highs.
All indications are that now is an important critical point, which will set the direction of price movements in the medium term.
Going into a short position is now much riskier than trying to catch a counter-trend deal. Opening a short position for us would be wise after the $43 test mark. As long as we see the local weakness of sellers there is a chance to catch a correctional wave up:
AXS trade
Entry: $27.4-28
Stop : $24.97
TP-1: $34.2
TP-2: $43
Importantly:
1) The size of the position must be smaller than usual (counter-trend agreement)
2) The size of the position should be divided into 2-3 inputs. One part to go today, the other - May 7-8 (if buyers keep the price). The last entry into the position should take place after active rebounds of the AXS price up.
We recommend that you follow these rules when trading against a trend. So you will not miss trading situations and in case of error (and they will be) losses will be controlled.

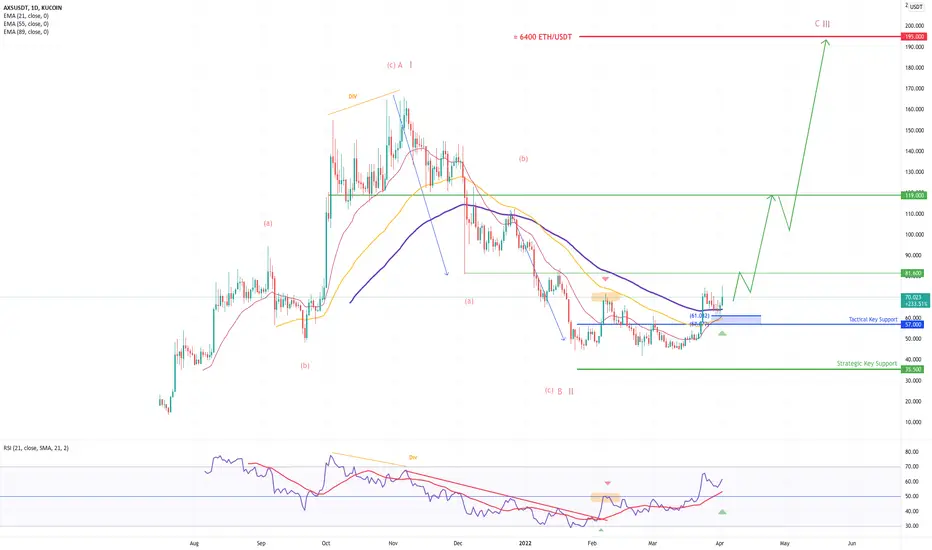
Axie Infinity AXS/USDT : Recovery expected towards 119,00Axie Infinity AXS/USDT : Recovery expected towards 119,00 (Update)
Axie Infinity is a blockchain-based trading and battling game that is partially owned and operated by its players.
The Axie Infinity ( AXS ) token is an ERC-20 token launched on the Ethereum blockchain. As a result, it is secured by Ethereum’s proof-of-work (POW) consensus mechanism.
Previous Analysis :
10/02/2022 :
Context
AXS /USDT has been listed in the middle of the last year, so the historical data are not really mature for a deep target projection. However Focusing on Daily and 3H basis we can already highlight key technical elements to understand the actual picture
For now the initial raise can be describe in 3 wave up move (Corrective - A/) or 5 wave up move (Impulsive I/) - depend if you switch the scale between lin or log, on my side i would be more confortable with an impulsive move at this stage. So once that it said and as i described on the chart, the following move (down leg) has been done in 3 wave down (A-B-C corresponding to a logic corrective move in wave B/ if we are in ascending range towards 195.00 and more if we are in a impulsive long-term trend - it what we are calling a ''common part'' between to different scenario)
So the configuration is quiet nice because the wave A = Wave C and the market bounced off 50/61,8 retracement which are standard to respect a proportion for this kind of Harmonic / elliot wave pattern, the determinism of the behavior behind the scene is strong a significant rise is clearly more likely.
Tactical view (1 to 3 weeks)
As you can see for now the RSI and the 55/89 EMA provide a clear bullish signal, all the EMA are acting as support now . This setup is strongly bullish and will be clearly validated by surpassing 81,60 (upside confirmation level).
As long as 57 remains key tactical support ( Pivot ) a direct rise is more likely towards 81,60 before 119,00
else penetrating 57 a test of 35,50 Strategic key support ( Pivot ) will occur before any bullish tentative
Also i recommand to have a look on SLP /USDT which is also a native ERC20 coin connect to Axie ecosystem, -analysis here =>
Enjoy my friend ! and support me please by activating your referal code for the app we built with my team (Get 200 EUR in AKTIO COIN) Link in my signature below ;)
Axie Infinity (AXS) Buy ZoneAxie Infinity (AXS) Buy Zone
--------------------
BIAS
Mid-Term : Bullish
Risk : High
On 4 hours timeframe Axie Infinity formed bullish pattern which shows the possible reversal at $29 zone.
--------------------
$AXS/USDT LONG SETUP
Leverage : x3 - x5
Entry Price : 28.8 - 27.9
TP 1 : 31
TP 2 : 32.5
TP 3 : 33.9
TP 4 : 35.25
TP 5 : 37.8
TP 6 : 39.75
TP 7 : 42.4
TP 8 : 46
Stop Loss : 26.5
*Maximum 3% of Portfolio.
*Unload 12.5% at each TP. Whenever TP 2 hits, Move stop loss to entry.
--------------------

🚀GALA: where to BUY? Amazing setup after a HUGE liquidation!📈Gala Games(GALA) is in the downtrend for 1 month. Why is it good and when to open a long trade?
When crypto is in a long consolidation or downtrend, it becomes "healthier". Weak hands, retail investors, novice traders begin to close their positions at a loss or break-even because of exhaustion and waiting for 10000%. Who are they selling to? They sell to those who know how to wait, who have been in the market for a long time🐳
💡We have to wait for the beginning of an uptrend movement to open a trades to gain more profit and have a low risk. If you dont know what is a trend and why it`s so important for trader read this article!
Reversal points and triger to open a LONG will be the HUGE liquidations! You can see it on the volume indicator and they are marked on the chart also.
Where the liquidations are most possible:
🔶the key level of $ 0.153. At this point there is a lot of stop-loss traders and a lot of liquidity for a large player.
🔶the support zone of $0.115-0.136. Even more liquidity and more panic sells😓
🔥Fuel for growth will be the traders who will open shorts on these corrections!
🎯Targets:
1. $0,32-0,37
2. $0,45-0,51
Wait for updates, be careful and don't become a fuel!😉
Friends, press the "like"👍 button, write comments and share with your friends - it will be the best THANK YOU.
P.S. Personally, I open an entry if the price shows it according to my strategy.
Always do your analysis before making a trade.


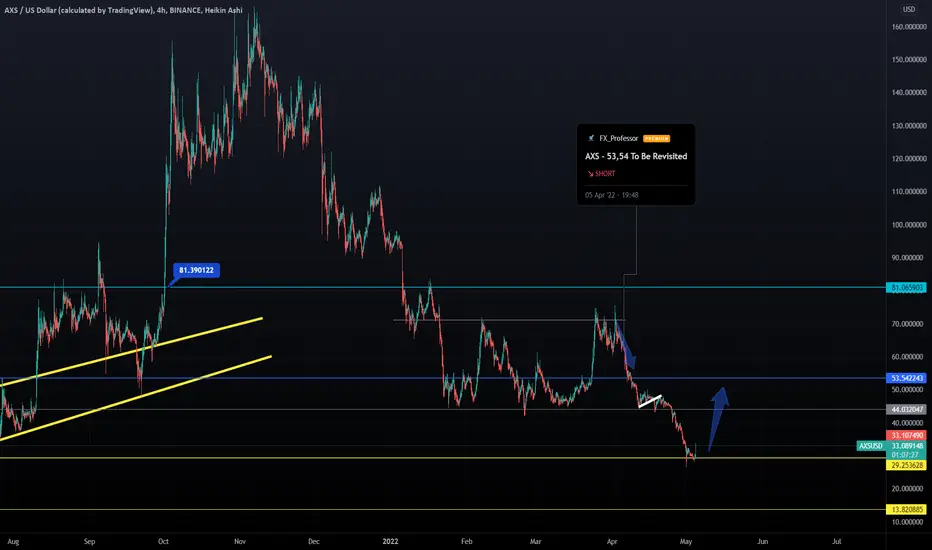
AXS - Back On The RISEAXS needed a break and to touch base with reality... and now is time for Higher
That's our chart saying, not sure about the fundamentals and all but Play to Earn sounds like a winner.
Have some fun and read this now : ''My brief wondrous life as an Axie Infinity gamer''
Crypto rookie Joel Stein dives into Axie Infinity and the curious economics of ‘play to earn.’ Will his teenage gaming dreams come true?
''Of course I want to play to earn. I want to earn money doing all the things I enjoy. Eat to earn? Sure. Watch TV to earn? I’m in. Sex to earn? Historically that’s had complications, but I’m confident that the blockchain can work those out. ''
REF: forkast.news
One Love,
the FXPROFESSOR
Trading opportunity in AXSUSDTBased on technical factors there is a long position in :
📊 AXSUSDT Axie Infinity
🔵 Long Now 32.80
🧯 Stop loss 26.00
🏹 Target 1 37.00
🏹 Target 2 45.00
🏹 Target 3 61.00
💸Capital : 1%
We hope it is profitable for you ❤️
Please support our activity with your likes👍 and comments📝

$axs heads and shoulders We have seen heads and shoulders fail a lot but, what if this plays out. That will mean over -50% drawdown.
Act accordingly

AXS/USDT Perpetual OKxdowntrend because of btc dominance and when btc price stables the alt's go up right ? so correct my ta.
still learning and gaining knowledge unto others ideas
careful long, wait for btc to calm down
not financial advice im just a regular MF
lets get that bread
remember big fish is no a small fish. smile :P

AXSUSDTpay attention to AXS , one of the good metaverses ;) this is my idea ! if you agree like it or disagree please write your idea in comment <3

Bullish Divergence + Order Block for AXSTarget is 70$. We can see a RSI bullish divergence . This shows a possible bull trend in AXS in the next few days
Orderblock indicator is also clear that possible target is 70$
We can check other indicator for conformity of this analysis.
Please DYOR and make ur own analysis. Use this only as a guide and NOT A FINANCIAL EXPERT Advise.

WHEN MOON : AXSAXS - into acclimation fase
Since the trend study high chance for a breakout.
- coin did show some breakdown trend - as BTC did breakdown also.
When moon?
Depending on more reasons - technically side AXS should show at last an increase - but there is no guarantee into markets - so on this side: AXS will be interesting to follow - and to see if this trends will happen or not.

$AXS Big longshort term swing for trend break
use SL below trendline . and sell according to our own comfort
Cheers,
Nav

AXS : When high chance for a breakout?AXS is depending on most of the study trading skills and signals on important trends for a breakout.
Since the last updates - AXS looks still not to make the expecting move
The BTC markets support most of the time the low coins, but the % price difference depends on the coin itself.
For AXS - it's important to hit at last the 47-48 USD to get the expecting breakout between 53-69 trend. between 12% and 46% is the model counting possibility.
Before that target AXS are into accumulation fase wich could change with time range.
The levels will stay still the same the 53-55 target and the 69 Target.
The above models are the expecting frames, which means there is no guarantee it will happen 100%
It's important to study all-time you trades well before entering any market.
It's always important to check the markets on all sides - markets can change all time.

Bullish on $AXS for a target of $90.8 with Aladdin says bullish- Aladdin has a buy sign
- Using Ichimoku, I see price entering the cloud
- $90.8 seems like a reasonable target

AXS still not have show the effect - THE BREAKOUTAXS is depending on most of the study trading skills and signals on important trends for a breakout.
Since the last updates 2 days ago - AXS looks still not to make the expecting move
Why is this?
First of all, the breakout could take some more time - and AXS checking also the market changes of BTC
Depending on the study there are more reasons why AXS should breakout, only the market has not confirmed it yet - for this reason, it's interesting to follow the trend to see or there will come setups that could get this coin into uptrend.
At this moment - AXS is also into the breakdown trend for the low time - and for this reason, it's only interesting to check it out.
The levels will stay still the same the 53-55 target and the 69 Target.
The above models are the expecting frames, which means there is no guarantee it will happen 100%
It's important to study all-time you trades well before entering any market.
It's always important to check the markets on all sides - markets can change all time.

GMT Repeat Same history as AXS infinity. GMT Repeat Same history as AXS infinity did.
AXS highest price was $166 per coin at that time Market cap was 9.75B of USD. Huge number
GMT current price is $3.16 with a market cap of 2B of USD. That means if this coin repat same history it could make an additional 5x. To reach a 10B market cap.
I think We can trade this coin during significant pullbacks because so many people bought a LOT of coins during IEO.
at $ 0.01 per coin rased $ 4,200,000. That means every dollars is made 321.98x ( +32,098.1% ) of profit.
PRIVATE sale. Price per coin was $ 0.005. Raise $ 5,000,000. Current RIO 643.96x ( +64,296.1% )
Friends, it's huge numbers. That means when the lock-up period will end part of people will sell their coins to the market.
that's why when u trade ALWAYS use STOP Losses. And book your profit as i mentioned in a video.

SLPusdt my crazy idea!Hello guys
its seems that SLp has never been able to breakout its downtrend channel and it keeps falling and falling
here is my idea on what may be happening to this token
Goodluck all!
