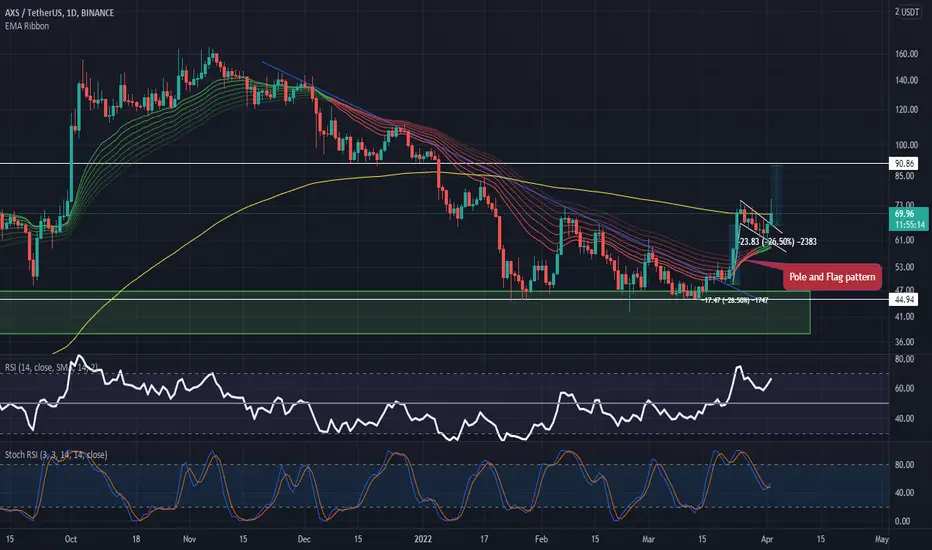
the hidden bullish formation is pointing to the $100 Axie Infinity Token is trading 11% higher today and the price action is forming a Poll and Flag formation on the daily price chart.
The daily price chart of the AXS token is looking above the green area of the Supertrend indicator. However, the coin saw a 150% increase in trading volume last night.
The EMA ribbon indicator is approaching a sit above the 200 EMA line, which was a short term bullish barrier. Thus, Stoch sees RSI below the halfway mark on the other hand simple RSI is going to test the overbought zone, which creates a bit of panic among the buyers.
As long as the Axie Infinity Token price remains above $60, buyers will continue the higher momentum. But still the price is below the 200 EMA line of the EMA ribbon indicator.
Support level - $45 and $35
Resistance level - $90 and $115
AXS
💡Don't miss the great buy opportunity in AXSUSD @AxieInfinityTrading suggestion:
". There is a possibility of temporary retracement to the suggested support line (66.73).
. if so, traders can set orders based on Price Action and expect to reach short-term targets."
Technical analysis:
. AXSUSD is in an uptrend, and the continuation of the uptrend is expected.
. The price is above the 21-Day WEMA, which acts as a dynamic support.
. The RSI is at 60.
Take Profits:
TP1= @ 74.56
TP2= @ 79.67
TP3= @ 84.25
TP4= @ 90.96
TP5= @ 97.94
SL= Break below S2
❤️ If you find this helpful and want more FREE forecasts in TradingView
. . . . . Please show your support back,
. . . . . . . . Hit the 👍 LIKE button,
. . . . . . . . . . Drop some feedback below in the comment!
❤️ Your support is very much 🙏 appreciated!❤️
💎 Want us to help you become a better Forex / Crypto trader?
Now, It's your turn!
Be sure to leave a comment; let us know how you see this opportunity and forecast.
Trade well, ❤️
ForecastCity English Support Team ❤️

💡Don't miss the great buy opportunity in AXSUSD @AxieInfinityTrading suggestion:
". There is a possibility of temporary retracement to the suggested support line (66.73).
. if so, traders can set orders based on Price Action and expect to reach short-term targets."
Technical analysis:
. AXSUSD is in an uptrend, and the continuation of the uptrend is expected.
. The price is above the 21-Day WEMA, which acts as a dynamic support.
. The RSI is at 62.
Take Profits:
TP1= @ 74.56
TP2= @ 79.67
TP3= @ 84.25
TP4= @ 90.96
TP5= @ 97.94
SL= Break below S2
❤️ If you find this helpful and want more FREE forecasts in TradingView
. . . . . Please show your support back,
. . . . . . . . Hit the 👍 LIKE button,
. . . . . . . . . . Drop some feedback below in the comment!
❤️ Your support is very much 🙏 appreciated! ❤️
💎 Want us to help you become a better Forex / Crypto trader ?
Now, It's your turn !
Be sure to leave a comment; let us know how you see this opportunity and forecast.
Trade well, ❤️
ForecastCity English Support Team ❤️

AXS, big BULLISH FLAG breakout! Axie Infinity (AXS)! A huge hackers attack happened on a gaming project this week! About $622M was stolen! How will this affect the price? Let's find out!
Right now the price is in the descending channel. Also, we can say that this is a bull-flag pattern. According to the rules, when the price breaks this flag, it should grow by 46% and reach the target of $90-100!
We expect a test of the $53-58 value zone and a false breakout! If a BIG player will buy, we will see it on the big volumes!
Will the price go up or down after the HACK? Write in the comments!
Friends, press the "like" button and share with your friends - it will be the best THANK YOU.
P.S. Personally, I open an entry if the price shows it according to my strategy.
Always do your analysis before making a trade.

AXS/USD Ready For A Big Move!We provide a video analysis of AXS/USD and why we believe price is ready to break through resistance . DM me if you would like to learn more about our Oscillator.

AXS flag breakoutPrice had nice daily close, wicking down to 20 day ema, closing with a moderate bullish spread. Price made impulsive move up followed by a very clean flag - channel printed on the 4 hour. Price broke out on the 30 min time frame with ultra high volume to the upside.
Stop loss: Just below daily s/r and vpvr level, inside of previous channel, and in trough of volatility zone measured thru out channel
Take profit: At next daily zone, aligning with the 0.272 fib extension level of flag

AXIS IS ON STEROID BUT PULL BACK IS IMMINENTThis asset has seen a great upward force lately, this has helped push the price of this asset positively.
AXS is currently at FIB23.6 and it may act as a resistance if the buying force is not enough to breakthrough.
I took profit today on my short term investment Axieinfinity with a whopping 40% return on investment.
My next TP will be at FIB38.2 which is around $90.
I am bearish for now.
trade with care.
Kindly like, comment and follow.

AXS is preparing to launch to 80-95 usd maybeNice support of white SMA, i am taking the risk here... but we need to be careful as new quarter is here... lets see....be patient with entry. Laddering always! :) Good luck guys.
NOT FINANCIAL ADVICE

Buy FUD Sell for NewsAXS have these range, where good push up from buy power can bring us to target i choose on chart
Good luck!

Is MANA going to PUMP? Look for liquidity collection!Decentraland (MANA) is the most popular Game-Fi project, so as soon as some news comes out, it is definitely Pump. But what does the technical analysis show?
As we can see by the horizontal volumes of $2.25-2.85 is a huge accumulation zone! A strong bullish signal would be to squeeze under the $2.85 level. Earlier we saw liquidity collection to sell, after which price dropped significantly.
Now we are expecting liquidity collection to buy and a volume growth. This will be a trigger to open long positions.
The first target for this move is the $3-3.10 zone, the second target is the $3.25-3.35 zone.
Friends, press the "like" button and share with your friends - it will be the best THANK YOU.
P.S. Personally, I open an entry if the price shows it according to my strategy.
Always do your analysis before making a trade.

AXIE INFINITY (AXS) amazing potencial LONG
Entry Point $68.5
TP Area : $253 - $420
n.40 Ranking
$4B Market Cap

Axie Infinity AXS Price PredictionMy Axie Infinity AXS Price Prediction i am short before long as there is a major resistance no buying volume include RSI is also indicating downside

AXS - Potential Bullish Reversal!Hello everyone, if you like the idea, do not forget to support with a like and follow.
AXS rejected our green demand zone and traded higher.
AXS broke the last minor high in orange, and the two upper trendlines (orange and red)
Thus, the bulls took over from a medium-term perspective. and the first blue projection is considered our first impulse of the bullish trend.
We are currently in a correction (in purple), and waiting for the bulls to break the upper gray area for the bulls to take over from a long-term perspective and the next bullish impulse to start.
Meanwhile, until the bulls break above the gray area, we are in a short-term correction phase that can trade till the green zone.
Good luck!
All Strategies Are Good; If Managed Properly!
~Rich

Best Long for AXSAXS is approaching its end in corrective phase. Based on its fibonacci retracement, AXS will end its correction as in our entry point.
🟢 Mas cuan & Dr. Profit
AXS/USDT
Masuk/Entry: -
Leverage Cross Rata Kanan
TP: - -
SL:
Keep DYOR and good luck!

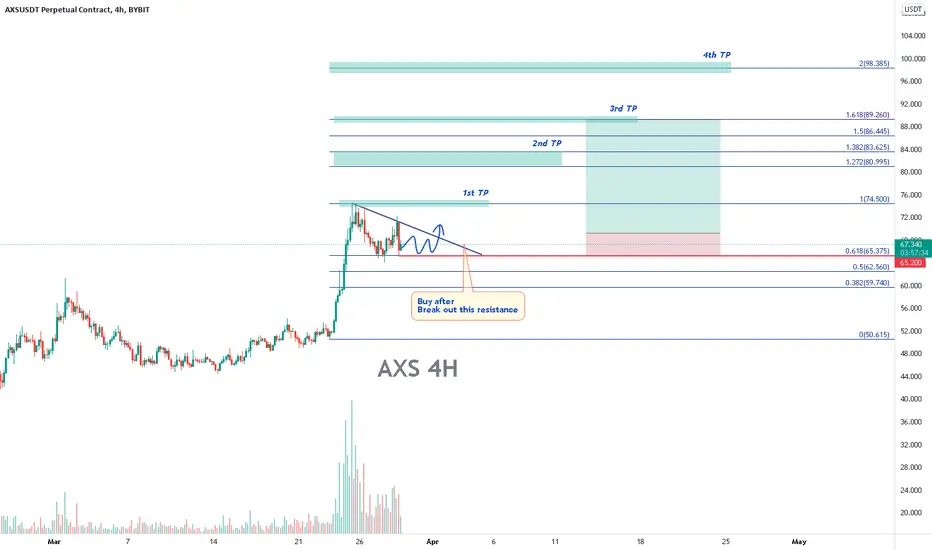
AXS - Buy it when break out this lineBYBIT:AXSUSDT
4H trend chart
-
AXS is consolidating and converging.
It's good for it to accumulate around $65
If price can break out the downtrend line, trading strategy as bleow.
-
Profit Targets:
a) 74.5----Fib(1)
b) 80.995~83.625----Fib(1.272~1.382)
c) 89.260----Fib(1.618)
d) 98.385----Fib(2)
Stop losses:
a) 10.882-----Red horizontal ray
-
If you like this analysis, smash the "like button" and leave a comment below to share your thoughts
or let me know what crypto you want to see!
Trading is a reflection of yourself. Learn more daily and be ready for every opportunity.
Have a nice trading!
AXS Starting New Leg Up?Looks like AXS is starting a new leg up if the support holds at the bottom median line of the Green Pitchfork.
Fairly smooth sailing once price clears a few local resistance zones.

buy AXS
Given the range of support can be a good opportunity to buy. In fact, the pullback is on the rise. Buy step by step with low lever. It is possible to modify bitcoins. Be sure to observe the loss limit.

AXSUSDT - SETUPAXSUSDT price is moving in a rectangular box and now bulls chase again the top of that zone and they are looking aggressive in this area. If they sustain the move they can easily move towards the next resistance level.

AXSUSDT-LONGBased on technical factors there is a long position in :
📊 AXSUSDT Axie Infinity
🔵 Long Now 69.26
🧯 Stop loss 63.93
🏹 Target 1 78.48
🏹 Target 2 91.91
🏹 Target 3 111.11
💸Capital : 1%
We hope it is profitable for you ❤️
Please support our activity with your likes👍 and comments📝


AXS/USDTesting/tracking elliot wave theory. Please do not trade off idea without S/L. Not financial advice.
Link to previous chart:
The counts were a bit off; wave 5 top was a lot lower and we've been correcting since then. The bottom also went a lot lower than predicted. We should be moving back up to the bigger wave (3) cycle.

AXS Bullish SoonAXS looks to have completed it's bearish impulse move with wave 5 (Feb 7-Feb 23) being confirmed with 5 fractal sub waves being counted inside.
Waiting to see how the market is on Monday before picking up this setup but I'm watching for bids around $46-47.

AXS/USDT Longs into $84Good long opportunities for AXS to play into these levels here between $65 and $49. We have a nice choCH on these lows here on this daily demand level so it could be a great opportunity to take some longs up once inefficiency or POI gets mitigated and we have some lower TF confirmation for longs.
