Short AXSAXS showed an Adam & Eva bullish pattern, and will fill the FVG between 69 and 74. Then, a bearish Cypher Pattern will be completed and a significant pullback should be performed.
AXS

Bearish on $AXS for near $11 #AXS #AXSUSD $AXSUSDBearish on AXS for near $11
* Aladdin already called bearish on this one long time ago
* Alongside the market this may slowly fall and rest in peace near the demand zone as shown. It may have some potential in next cycle

Bulls Incentive For AXS Token Finally, is $100 Define Next move?The Axie Infinity Token has reversed its declining trend and started rising higher, seeing a nearly 44% spike this week.
Axie Infinity Token interpreted the 100-day moving average line yesterday and is consolidating to reach the 200-EMA.
The SuperTrend indicator gave a bullish sign last night over the daily price chart.
Axie Infinity Token price is being seen above the 20- and 50-day EMAs, as well as recently, holders pushed costs above the 100-EMA (Yellow) last night. Besides, the 200-EMA is forming a bullish barrier.
The RSI is moving towards an overbought zone in terms of the daily price chart. While the RSI is at 72-point, it indicates stability in the bullish momentum as long as the price action does not show any bearish signs.
Axie Infinity holders have a chance to achieve their goals once again. Following the sharp rise, the coin could pull back and the 100-EMA could act as a support zone for long-term investors of the AXS token.
Support level - $45 and $35
Resistance level - $90 and $115

AXS MASSIVE PUMP!!!AXS managed to pump for almost 50% after the breakout. And looking at the Stochastic RSI in the weekly timeframe indicates that Axs has much more room to go higher.

Axie infinity got a triple bull storm brewing. Much like ethereum, Axie Infinity has an Adam and Eve double bottom, a larger standard double bottom, and an inverse head and shoulders all rolled into one. Unlike the ethereum inverse head and shoulders, the one here on axie may not be valid as it does appear that the right shoulder has a slight wick lower than the wick of the head…but if the inv h&s pattern on this one is not valid, we should still reach its target and beyond on the way to both of the double bottom targets… unless of course some major black swan event were to occur and cause a massive sell off. Barring that, probability is favoring the bulls on this one. *not financial advice*

Axie Infinity Daily Chart AnalysisYesterday we looked at Axie Infinity (AXSBTC) on the weekly/long-term chart... Today we will have a look at the daily timeframe.
First, we can see how nicely EMA50 and EMA100 match the Fibonacci numbers.
We have the highest volume bar since November 2021 and a break above EMA50 yesterday and EMA100 today.
Bullish indicators, MACD and RSI.
Now, my reason to post this is to show you the next target.
The main resistance short-term for this bullish move is the 1.618 Fib. extension level at 0.002061.
It is possible to have a correction or small retrace after this level is reached and then another jump to 2.618 Fib. which is sitting at 0.002633.
If you are trading this daily, you now have a better view of what is going to happen next.
I hope you enjoyed this analysis.
Thanks a lot for the continued support.
I Love You! :D
Namaste.

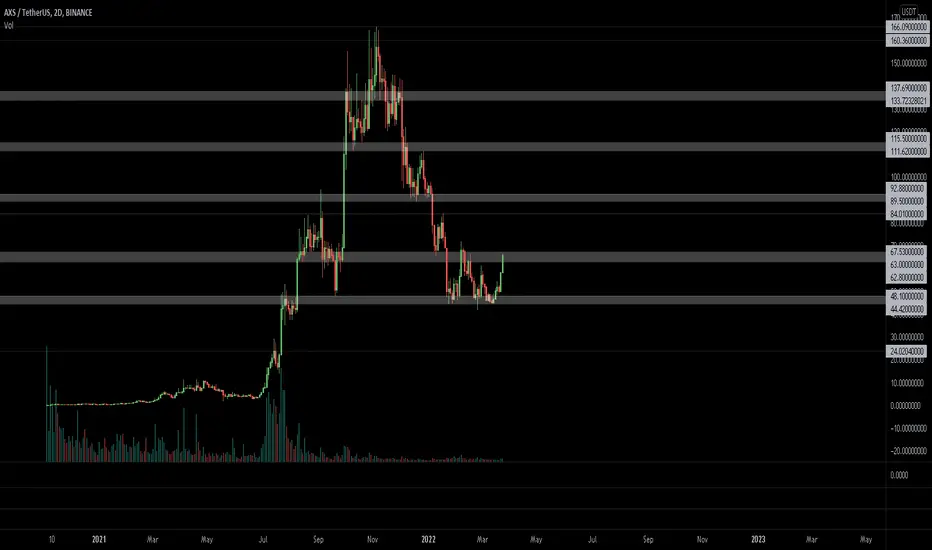
AXSUSDT - Weekly Technical Analysis UpdateMidterm forecast:
While the price is above the support 37.6000, beginning of uptrend is expected.
We make sure when the resistance at 91.0875 breaks.
If the support at 37.6000 is broken, the short-term forecast -beginning of uptrend- will be invalid.
Technical analysis:
There is a divergence in RSI and price between the trough at 44.42 on 2022-01-24 and the trough at 41.9 on 2022-02-24, the probability of downtrend continuation is decreased and the probability of beginning of uptrend is increased.
The RSI resistance #1 at 51 is broken, so the probability of beginning of uptrend is increased.
A trough is formed in daily chart at 41.9000 on 02/24/2022, so more gains to resistance(s) 65.1427, 83.0000 and maximum to Major Resistance (91.0875) is expected.
Price is above WEMA21, if price drops more, this line can act as dynamic support against more losses.
Relative strength index ( RSI ) is 68.
Take Profits:
65.1427
83.0000
91.0875
111.6055
120.4969
138.8161
166.1540
220.0000
❤️ If you find this helpful and want more FREE forecasts in TradingView
. . . . . Please show your support back,
. . . . . . . . Hit the 👍 LIKE button,
. . . . . . . . . . Drop some feedback below in the comment!
❤️ Your support is very much 🙏 appreciated!❤️
💎 Want us to help you become a better Forex / Crypto trader?
Now, It's your turn!
Be sure to leave a comment; let us know how you see this opportunity and forecast.
Trade well, ❤️
ForecastCity English Support Team ❤️

AXSUSDT - Weekly Technical Analysis UpdateMidterm forecast:
While the price is above the support 37.6000, beginning of uptrend is expected.
We make sure when the resistance at 91.0875 breaks.
If the support at 37.6000 is broken, the short-term forecast -beginning of uptrend- will be invalid.
Technical analysis:
There is a divergence in RSI and price between the trough at 44.42 on 2022-01-24 and the trough at 41.9 on 2022-02-24, the probability of downtrend continuation is decreased and the probability of beginning of uptrend is increased.
The RSI resistance #1 at 51 is broken, so the probability of beginning of uptrend is increased.
A trough is formed in daily chart at 41.9000 on 02/24/2022, so more gains to resistance(s) 65.1427, 83.0000 and maximum to Major Resistance (91.0875) is expected.
Price is above WEMA21, if price drops more, this line can act as dynamic support against more losses.
Relative strength index (RSI) is 68.
Take Profits:
65.1427
83.0000
91.0875
111.6055
120.4969
138.8161
166.1540
220.0000
❤️ If you find this helpful and want more FREE forecasts in TradingView
. . . . . Please show your support back,
. . . . . . . . Hit the 👍 LIKE button,
. . . . . . . . . . Drop some feedback below in the comment!
❤️ Your support is very much 🙏 appreciated!❤️
💎 Want us to help you become a better Forex / Crypto trader?
Now, It's your turn!
Be sure to leave a comment; let us know how you see this opportunity and forecast.
Trade well, ❤️
ForecastCity English Support Team ❤️

$AXS, 30% over the last 48hs$AXS
If BAYC is the blue chip of the NFT, then AXS is the blue chip of the crypto-games?
30% over the last 48hs & showing a new UCTS 2D Buy signal (has to close)
Volume making HHs. If manages to hodl/flip this area, then aiming for ~90$
#AXS
Axie Infinity (AXSUSDT) mid tf Range Updated till 24-3-22Axie Infinity (AXSUSDT) midteir timeframe range. this is a fundamentally beast of an alt for its virtual use-case and active development. but i am here to talk about some Technical sides here. its got pretty decent price action cause of volume of course. it got swing setups, intraday setups, there are some scalp setups too but risk is kinda little bit higher than leveraged profit. there are not much of space between its zones its been occupied for the scalps and microtrades.

Axie Infinity Eternal Uptrend vs Correction, Bullish Jump Ahead!Here is one of those Altcoins with an "Eternal uptrend".
We can see the classic 5 wave count from our friend R.N. Elliot, followed by an ABC correction that landed at EMA50 and/or the 0.618 Fib. retracement level for the last bullish wave.
This can signal that a new jump is about to take place.
Zoom in on the correction:
We can see the descending channel being broken.
EMA50 working as support.
The new +1 count on the TD sequential,
A this weekly candles bullish jump.
How do you like it?
Thanks a lot for the continued support.
Namaste.

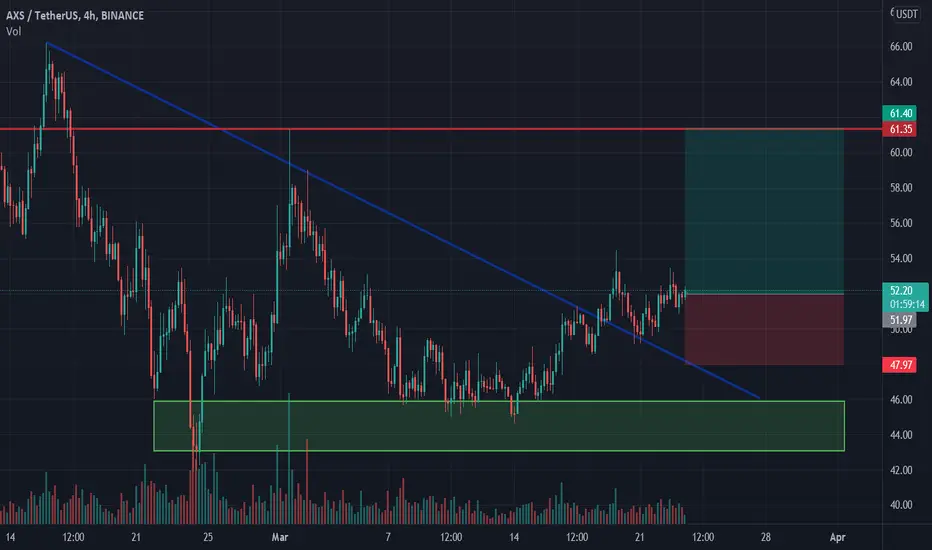
Axie Infinity longAxie Infinity bounced off the support area. Asset broke trough off the descending trendline. Bullish movement to resistance level at 61.35 is possible.
AXS - Video Top-Down Analysis!Hello TradingView Family / Fellow Traders. This is Richard, as known as theSignalyst.
Here is a detailed update top-down analysis for AXS.
Which scenario do you think is more likely to happen? and Why?
Always follow your trading plan regarding entry, risk management, and trade management.
Good Luck!
All Strategies Are Good; If Managed Properly!
~Rich

AXS breakout longPrice has been holding long term daily support floor. Had a downtrend line that was broken to the upside 2 days ago and has been holding it and daily 20 ema line as support. Price had broke out on the 4h chart and has been forming flag. 2h and 1h charts are seeing bullish divergence on stoch as price is respecting a new short term uptrend line. Price had a 38% retracement from lows. Have bullish bias on total market for near term, this is a hedge to my short positions

axs and qm pattern formationHello friends
Due to the condition of the axes and the formation of the qm pattern, there is a possibility of falling to the specified area
This is a personal opinion and is not a buy or sell offer

FTM, The best opportunity to BUY only after THIS!Fantom (FTM) is squeezing under the big trend line. The mirror level of $1.3 is resistance now.
We expect the price drop and liquidity collection below the current level, where large capital can take its long positions.
High volumes, an example of which you can see in the bottom panel, will be a good indicator of a BUYER. After that a test of the key level of $1.15 and continuation of growth is very possible.
Friends, press the "like" button, write comments and share with your friends - it will be the best THANK YOU.
P.S. Personally, I open an entry if the price shows it according to my strategy.
Always do your analysis before making a trade.

AXS, trendline BREAKOUT with potential target!Axie Infinity (AXS), the top Game-Fi crypto token, is in a downward trend.
A trend line has formed on the chart and the price is starting to squeeze under it. This, of course, shows the strength of the bulls.
Also, a descending wedge has formed on the chart, which is a bullish pattern.
A possible target for this movement is the key level of $49.50, where a good chance to close your long position.
Friends, press the "like" button, write comments and share with your friends - it will be the best THANK YOU.
P.S. Personally, I open an entry if the price shows it according to my strategy.
Always do your analysis before making a trade.

AXS TA [LONG TERM]AXS one of the best assets now in the market fired a sell signal in weekly chart as investor this is the moment to start cashing out.
This asset born in the bull market.. I am expecting a significant correction if 125 level breaks.
Targets:
70 usd or lower if EMA 55 breaks in weekly.

new analyze about AXSI decide to analyze AXS again...
I expect, after seeing the range of .40, we'll see a 5-wave uptrend to the $60 range.

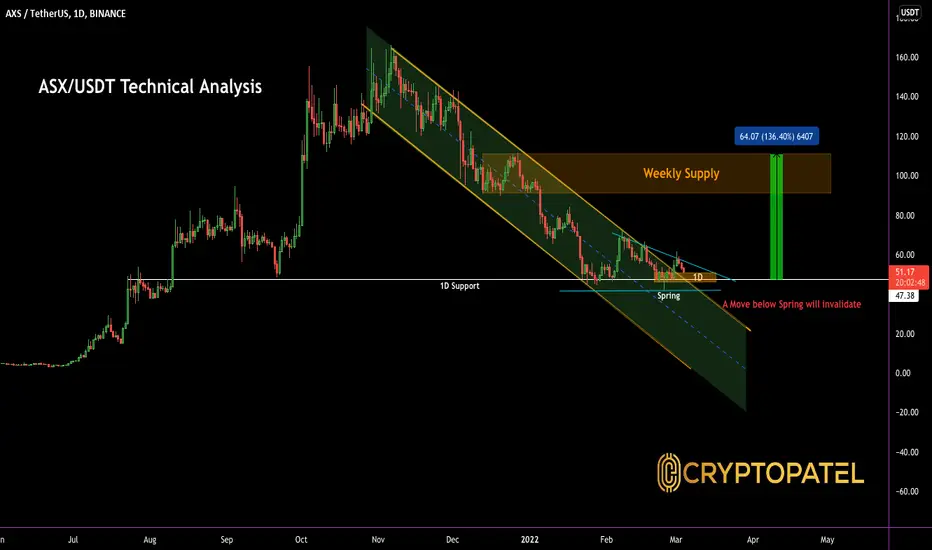
AXS/USDT Ready to move 136% from here as per TA ?#AXS/USDT TA Update:-
$AXS current price is $50.90
As Per chart Small Triangle form In HTF.
Rejected from Triangle resistance and Bouncing from 1D support.
So 1D Support is strong at $47 level.
Already Broke out this parallel channel resistance as per chart.
Targets will be Weekly supply which is $100-$120
Chart Invalidate below Spring.
Spring = $41.60
AXS USDT SHORT SWING | AXSUSDT | SHORT @ 50 - 49 | TP @ 48, 47, 46, 45, 44 | SL @ 59 | PATTERN = BLACK MARABOZU | FTX |
Swing trade idea. Kindly follow targets and stop loss. Will update with new targets once all 5 are achieved.

AXS booting up....AXS resting and accumulating in a demand zone....
Find entry, sl & tp in TA
Trade safe....
NB: Patience + risk management = Winning trades
#e2kclicks #axs

GOLD SHORT POSITIONHello dear friends
I marked everything on the chart, I hope you enjoy
******Appropriate entry poin ts for supports and resistances according to the chart*******
If you like this idea, Please Follow me and do not forget that your likes and comments are very important
Thanks dear friends.
Be generous and rich.
