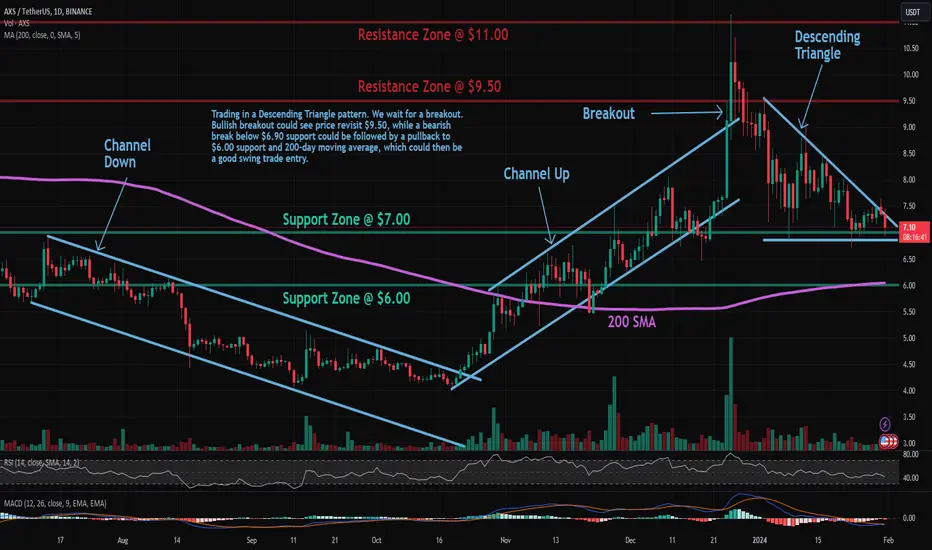
AXS: Descending TriangleTrade setup : Trends are mixed. Trading in a Descending Triangle pattern. We wait for a breakout. Bullish breakout could see price revisit $9.50, while a bearish break below $6.90 support could be followed by a pullback to $6.00 support and 200-day moving average, which could then be a good swing trade entry.
Pattern : Price is trading in a Descending Triangle pattern. Typically, a breakout will occur in the direction of the existing trend. Most traders will take a position once the price action breaks through the bottom line of the triangle with increased volume, which is when the price should decline an amount equivalent to the widest section of the triangle.
Trend : Neutral on Short- and Medium-Term basis and Uptrend on Long-Term basis.
Momentum is Bearish but inflecting. MACD Line is below MACD Signal Line and RSI is below 45 but momentum may have bottomed since MACD Histogram bars are rising, which suggests that momentum could be nearing another upswing.
Support and Resistance : Nearest Support Zone is $7.00 (previous resistance), then $6.00. The nearest Resistance Zone is $9.50, then $11.00.
AXS
AXS/USDT Eyeing for the Next Bull Run? 👀🚀 AXS Analysis💎Paradisers, let's focus on #AXSUSDT, as it's currently exhibiting signs of a potential robust bullish rebound from its important support zone.
💎Reviewing #AxieInfinity's recent market movements, we see a steady 39% decrease after reaching resistance at a significant supply level. However, its resilience around the support level of $7.00 indicates a potential for an upward trend.
💎Despite the present difficulty in reaching new highs or breaking past former peaks, which has led to a short-term bearish outlook, the $7.00 mark remains vital for #AXS. This level could potentially trigger a strong bullish surge upon retesting.
💎As proactive traders, we're prepared with a secondary strategy. If #AXS weakens at the $7.00 support and declines further, we're looking at a bullish resurgence beginning from the lower support level at $6.4. It's crucial to note, however, that a fall below this additional support might herald extended downtrends.
💎Stay flexible in your trading strategies and vigilant with the market trends, Paradisers. Your ParadiseTeam is diligently monitoring, ready to navigate you through these market shifts.

ASX Aims 8% HIGHERAXS is showing bullish price action. Price has moved up to the next major resistance level. Once we break this trend line, I will then switch my bias to bullish and look to enter a long.
It is looking good after a sweep of the lows.
Calculate Your Risk/Reward so you don't lose more than 1% of your account per trade.
Every day the charts provide new information. You have to adjust or get REKT.
Love it or hate it, hit that thumbs up and share your thoughts below!
This is not financial advice. This is for educational purposes only.

#AXSIn the low times of H2 and also in the daily time of D1, it is moving in an upward channel, which after the recent correction, which corrected 50% of the previous wave, this upward trend can now continue, with the minimum ability to grow up to the range of 100. The percentage of the previous corrective wave can move itself. The upcoming goals can be $10 first and then $13.5 - $16.5 - $25. Time D1 range of 6 dollars can be valid currency support.

#AXS Waiting for a reversal candle in the $9.37 areaIn an upward trend, after reaching the target and exiting the short-term channel and breaking the specified box resistance, a correction is currently observed, which should be able to stabilize above the 9.37 range, otherwise, we can enter a sell position up to the specified range. . Therefore, if it stabilizes above 9.37, we will have the scenario of continuing the upward trend, which can continue up to the areas of 12.5 and 14 dollars.

AXS: Falling Wedge BreakoutTrade setup : Bullish breakout from Falling Wedge pattern signals resumption of Uptrend, with upside potential to $9.50 near-term and $11.00 medium-term. Stop Loss (SL) level at $6.80 (just below the prior swing low and nearest support zone).
Patterns : Falling Wedge Usually results in a bullish breakout. When price breaks the upper trend line the price is expected to trend higher. Emerging patterns (before a breakout occurs) can be traded by swing traders between the convergence lines; however, most traders should wait for a completed pattern with a breakout and then place a BUY order.
Trend : Neutral on Short-Term basis and Uptrend on Medium- and Long-Term basis.
Momentum is Mixed as MACD Line is below MACD Signal Line (Bearish) but RSI ~ 50 (Neutral). MACD Histogram bars are rising, which suggests that momentum could be nearing another upswing.
Support and Resistance : Nearest Support Zone is $7.00 (previous resistance), then $6.00. The nearest Resistance Zone is $9.50, then $11.00.

AXS: Falling Wedge BreakoutTrade setup : Bullish breakout from Falling Wedge pattern signals resumption of Uptrend, with upside potential to $9.50 near-term and $11.00 medium-term. Stop Loss (SL) level at $6.80 (just below the prior swing low and nearest support zone).
Patterns : Falling Wedge Usually results in a bullish breakout. When price breaks the upper trend line the price is expected to trend higher. Emerging patterns (before a breakout occurs) can be traded by swing traders between the convergence lines; however, most traders should wait for a completed pattern with a breakout and then place a BUY order.
Trend : Uptrend across all time horizons (Short- Medium- and Long-Term).
Momentum is Mixed as MACD Line is below MACD Signal Line (Bearish) but RSI ~ 50 (Neutral). MACD Histogram bars are rising, which suggests that momentum could be nearing another upswing.
Support and Resistance : Nearest Support Zone is $7.00 (previous resistance), then $6.00. The nearest Resistance Zone is $9.50, then $11.00.

short AXSNYSE:AXS broke through the ascending trendline. Decline to support level at $5.49 is expected to happen next

AXS/USDT The trend is still Bullish. Ready to continue Upward ??💎 AXS is currently showcasing a rebound from a key support zone, aligning with a bullish trendline. The prevailing market trend for AXS remains robustly bullish, evidenced by the consistent formation of higher lows and higher highs on the chart, which are classical indicators of a bullish trend.
💎 If this retesting phase proves successful, AXS is poised to extend its upward journey, with the supply area being the immediate target. A decisive breakout above this supply zone probability could pave the way for AXS to reach the strong resistance area, which is set as our next target.
💎 However, should AXS retreat to the support zone and breach below it, the scenario could take a bearish turn. Breaking down the support would not only signify a failure to sustain the bullish momentum but also indicate a potential trend reversal. In such a case, AXS might be steered towards a downward trajectory, with the demand area becoming the next critical focus.
💎 The demand zone thus emerges as a pivotal area for AXS. For the asset to resume its upward trend, a strong rebound from this level is essential, coupled with a successful reclamation of the resistance zone. Failure to achieve this bounce-back could lead AXS to persist in its downward movement, potentially heading towards the significant support level at around $4.1.
💎 Investors and traders should keep a close watch on AXS's response to these crucial support and resistance levels. The asset's behavior at these junctures will be instrumental in determining its short-term price action. Stay alert to these market developments to effectively adapt investment strategies.

AXS/USDT possible next move ? 👀 🚀 AxieInfinity analysis💎 Paradisers, direct your attention to #AXSUSDT as it displays a strategic positioning in the market. Currently maintaining a key support level, it is gearing up for its next probable market move.
💎 Tracing #AxieInfinity past behavior, it has shown a tendency to adhere to a descending trendline before breaking above to initiate an upward trend. However, recent market volatility has led to a rejection from its supply zone, and now NYSE:AXS might be heading back to retest a resistance-turned-support level at $6.91. Here, we’re looking at two potential scenarios.
💎 If AXS sustains strong momentum above this support, it could embark on a bullish journey to challenge higher supply levels. Alternatively, it might pivot to a bullish movement from another support point at $6.27.
💎 Should #AXS breach the support at $6.27, it may set in motion a downward trend towards the Bullish Order Block (OB) level. This potential shift underscores the need for strategic vigilance in navigating its market movements. 🌴💰

AXSUSD - Recovery IdeaUsing the chart pattern of an inverted head and shoulders to suggest a recovery for AXS
Plotted some resistance lines along the horizontals.
Very cheap right now.

#AXSIn the 4-hour timeframe, due to the positive momentum, it is in a medium-term ascending channel, which is currently forming a corner pattern, which can continue its growth by exiting the density.
In addition, the touch of the $6 range of this analysis will be invalidated.

Axie Infinity AXS Coin Price Prediction🔥 Price on the 4H chart might come at these support area and we might get a potential bounce🔥
Potential bounce areas for Buying 9.20 and 8.00
👉 Follow me for More Real Time Opportunities.
Share your Thoughts if you have any?

AXS/USDT$ AXS is just a BIG WOW, pure 70% from the perfect entry suggested by the
@TheCryptoCity1
It just simple, you need visualization and experience to find out best trades. Follow us for exclusive trades and analysis.
$ANALOS Luna #JASMY #MEXC Matic IDX:FREN

AXS: Channel UpTrade setup : Price is in an Uptrend, trading in a Channel Up pattern. Upside potential to $9.50. Stop Loss at $6.40 (prior swing low).
Pattern : Price is trading in a Channel Up pattern. With emerging patterns, traders who believe the price is likely to remain within its channel can initiate trades when the price fluctuates within its channel trendlines. With complete patterns (i.e. a breakout) – initiate a trade when the price breaks through the channel’s trendlines, either on the upper or lower side. When this happens, the price can move rapidly in the direction of that breakout.
Trend : Uptrend across all time horizons (Short- Medium- and Long-Term).
Momentum is Bullish (MACD Line is above MACD Signal Line and RSI is above 55).
Support and Resistance : Nearest Support Zone is $7.00 (previous resistance), then $6.00. The nearest Resistance Zone is $9.50.

SAND Wake UpI expect SAND to rise beyond the mentioned levels at $0.70, $0.94, $1.49. While we see most crypto pumped neatly, metaverse tokens are still stuck. Btw, you should keep in mind that The Sandbox which runs for more than 10 years is not something to make you upset in long-term!

AXS: Channel UpTrade setup : Price is in an Uptrend, trading in a Channel Up pattern. Upside potential to $9.50. Stop Loss at $6.40 (prior swing low).
Pattern : Price is trading in a Channel Up pattern. With emerging patterns, traders who believe the price is likely to remain within its channel can initiate trades when the price fluctuates within its channel trendlines. With complete patterns (i.e. a breakout) – initiate a trade when the price breaks through the channel’s trendlines, either on the upper or lower side. When this happens, the price can move rapidly in the direction of that breakout.
Trend : Uptrend across all time horizons (Short- Medium- and Long-Term).
Momentum is Mixed as MACD Line is below MACD Signal Line (Bearish) but RSI ~ 50 (Neutral).
Support and Resistance : Nearest Support Zone is $7.00 (previous resistance), then $6.00. The nearest Resistance Zone is $9.50.

short AXSNYSE:AXS broke through the ascending trendline. Bearish movement to support level at $6.27 is expected to happen.

AXS: Channel UpTrade setup : Following a bullish breakout from Channel Down pattern, price also broke above 200-day moving average, which confirmed a bullish trend reversal to an Uptrend. Now it’s broken above $7.00 resistance area, where it got recently rejected, and could revisit $9.50 next. It’s also trading in a Channel Up pattern.
Pattern : Price is trading in a Channel Up pattern. With emerging patterns, traders who believe the price is likely to remain within its channel can initiate trades when the price fluctuates within its channel trendlines. With complete patterns (i.e. a breakout) – initiate a trade when the price breaks through the channel’s trendlines, either on the upper or lower side. When this happens, the price can move rapidly in the direction of that breakout.
Trend : Uptrend across all time horizons (Short- Medium- and Long-Term).
Momentum is Mixed as MACD Line is below MACD Signal Line (Bearish) but RSI > 55 (Bullish).
Support and Resistance : Nearest Support Zone is $7.00 (previous resistance), then $6.00. The nearest Resistance Zone is $9.50.

AXS: Channel UpAxie Infinity (AXS) technical analysis:
Trade setup : Following a bullish breakout from Channel Down pattern, price also broke above 200-day moving average, which confirmed a bullish trend reversal to an Uptrend. Now it’s broken above $7.00 resistance area, where it got recently rejected, and could revisit $9.50 next. It’s also trading in a Channel Up pattern.
Pattern : Price is trading in a Channel Up pattern. With emerging patterns, traders who believe the price is likely to remain within its channel can initiate trades when the price fluctuates within its channel trendlines. With complete patterns (i.e. a breakout) – initiate a trade when the price breaks through the channel’s trendlines, either on the upper or lower side. When this happens, the price can move rapidly in the direction of that breakout.
Trend : Uptrend across all time horizons (Short- Medium- and Long-Term).
Momentum is Bullish but inflecting. MACD Line is above MACD Signal Line and RSI is above 55 but momentum may have peaked since MACD Histogram bars are declining, which suggests that momentum is weakening.
Support and Resistance : Nearest Support Zone is $7.00 (previous resistance), then $6.00. The nearest Resistance Zone is $9.50.

AXS/USDT Bullish Momentum??? Break the Supply or retesting first💎 AXS has undeniably emerged as a market focal point. Its recent trajectory showcases a triumphant breakout from the falling wedge, further solidified by a subsequent and valid retesting phase.
💎 Observing its chart, one can note that post its retest on the demand zone, AXS experienced a sharp upward surge, effortlessly breaching the supply threshold. However, its journey doesn't seem to halt there.
💎 While AXS has yet to undergo a retest after surpassing the supply zone, an optimal trajectory would see it first revisiting the demand area before setting its sights on the next supply target at $6.12. Should AXS bypass this retesting step and directly vault over the $6.12 supply mark, it could be poised for a more extensive bullish run, probability targeting the major supply zone and the bearish OB.
💎 On the flip side, markets are unpredictable. A less favorable turn of events might see AXS retracing its steps to the demand zone. If, during this phase, AXS falters and fails to uphold its position above the demand, it could signal a bearish shift. This downturn might see AXS descending further, potentially seeking refuge at a more foundational support level, underscoring the delicate interplay between bullish aspirations and bearish realities in the crypto landscape.

AXSAre you guys following our trades?
NYSE:AXS is looking good, started its journey to the next highs.

AXS: Resistance BreakoutAxie Infinity (AXS) technical analysis:
Trade setup : Following a bullish breakout from Channel Down pattern, price also broke above 200-day moving average, which confirmed a bullish trend reversal to an Uptrend. Now it’s broken above $7.00 resistance area, where it got recently rejected, and could revisit $9.50 next.
Trend : Uptrend across all time horizons (Short- Medium- and Long-Term).
Momentum is Bullish (MACD Line is above MACD Signal Line and RSI is above 55).
Support and Resistance : Nearest Support Zone is $6.00 (previous resistance), then $4.50. The nearest Resistance Zone is $7.00, which it broke, then $9.50.
