AXS BUY SETUPHi, dear traders. how are you ? Today we have a viewpoint to BUY/LONG the AXS symbol.
For risk management, please don't forget stop loss and capital management
When we reach the first target, save some profit and then change the stop to entry
Comment if you have any questions
Thank You
AXS

Axs Getting Ready For Another Breakout Seems Like Getting Ready For Further Bullish Move
Forming Bulish Pennant In 8 Timeframe
Incase Of Breakout Expecting 45 - 50% Bullish Move
Keep Eyes On Axs For Breakout

Age of Gods: $0.016 | An opportunity of a Lifetime funding round usually takes 6 to 18 months
and with that period another 36months to deliver obligation
obligation is to re pay funds park to finance Project such as this Age of Gods game
the usual pay out is 5x to 10x coming from Fresh recruits done the Events the likes of Dubai in feb and Texas in April 2023
buy and good luck guys.. and dca accordingly

AXSUSDT LONG SETUPThis is my setup for going long on AXS over the next few hours. I expect the price to go to the upper trend line again and return to the lower support line, and from there on, I have no idea. If you know something, tell me in the comments .
Content is for informational purposes only and not financial advice

AXS strong resistanceIn the four-hour chart, AXS is under relatively strong selling pressure at 10.245, and the price has large price action here.
-
At present, AXS is in an upward trend. If it does not fall below the trend line and the previous low of 7.610, it has a chance to break through 10.245.
-
After breaking through 10.245, focus on the upper target:
11.825
13.040
14.760
15.840
-

AXS USDTFinally, the uptrend line of AXS was broken and it is currently in a falling channel. It is below the 200 EMA in the 4-hour time frame. If we believe in the downward trend of the market, the scenario in front of us will be the most likely scenario.

AXS's price reacted to the resistance rangeAXS's price reacted to the resistance range of $11.78 to $12.50 after successive collisions.
The resistance for which it is intended is the range, the breaking of which could change the trend in the daily time frame from range to bullish.
But the solid negative reaction observed to this level has caused the movement to range between this resistance and support from $8.40 to $9.40. Also, the 50% retracement Fibonacci retracement was just within the designated support area, reinforcing this level.
So as long as this range is maintained, there is potential for further growth and breaking the resistance ahead. Also, in case of breaking and continuing the upward trend, higher targets range from 18.5 to 20 dollars.

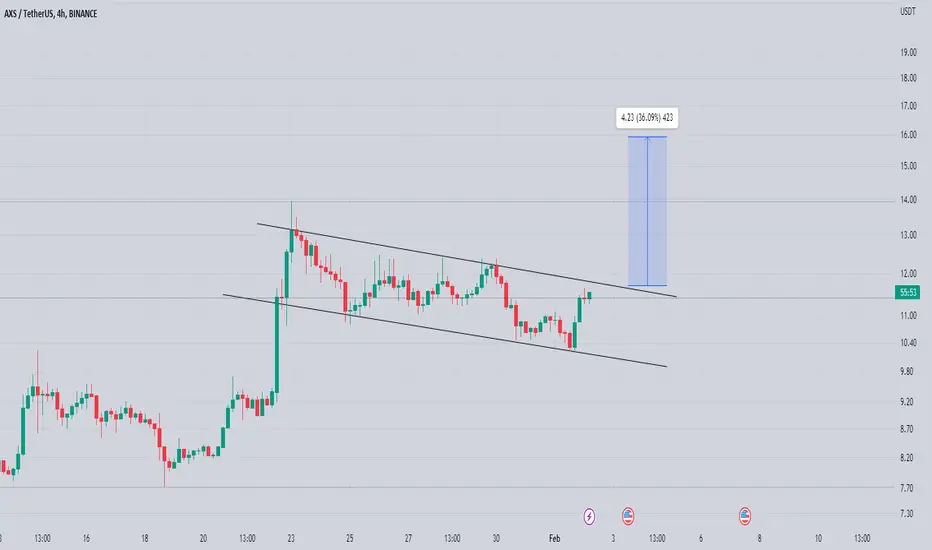
AXS/USDT | Pretty Solid Descending Channel Consolidation..!!
#AXS Looks Promising here 🔥
Pretty Solid Consolidation in Descending Channel, Seems like Bottomed out & Ready to Fly.
In Case of Breakout, Expecting +400% Bullish Rally in the Midterm..🏄♂️
It's important to maintain a Disciplined and Patient approach to investing in order to achieve Long term Success.
Please like the idea for Support & Subscribe for More ideas like this and share your ideas and charts in Comments Section..!!
Thanks for Your Love & Support..!!

AXSUSDT LONG SIGNALSHi, friends. Nice to meet you.
You're all having fun trading, aren't
AXS is currently located in the sales section and believes it will rise soon.

AXSUSDTI see a Bull Flag breakout forming in the Daily chart of AXSUSDT.
Bull flags are usually a continuation pattern but I'm waiting on next daily candle close above the resistance to confirm the bullish breakout.
The volume is increasing with it so it's possible to continue the bull trend it started.
Both my take profits are shown which are major resistance zones.

AXS LONG SETUPHi, dear traders. how are you ? Today we have a viewpoint to BUY/LONG the AXS symbol.
For risk management, please don't forget stop loss and capital management
When we reach the first target, save some profit and then change the stop to entry
Comment if you have any questions
Thank You

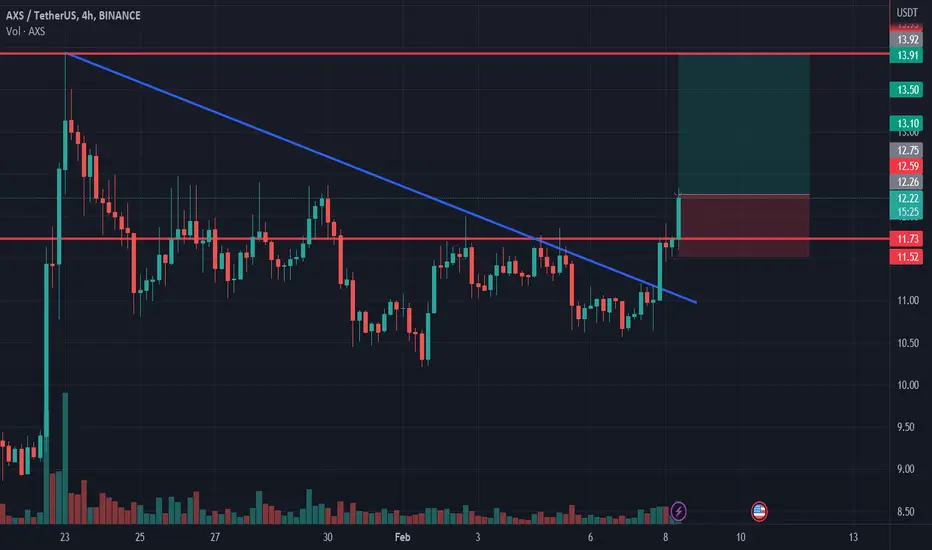
AXS longAXS broke trough the descending trendline. Asset broke trough the resistance level. Bullish movement to resistance level at 13.9 is expected to happen.
Reposting list for Altcoins, many have run nicely alreadyDO NOT FOMO on #crypto (Don't be noob)
DISCIPLINE
Buy on pullbacks
Keep number where you want to limit losses (stop loss)
Here is a nice list of good fully diluted #altcoins
Many have gone up already
DO YOUR OWN DD!
PLEASE SEE LINK BELOW!


Axs Forming Bulish Flag Forming Bulish Flag In h4 timeframe
Incase Of breakout Expecting 25 to 30% bulish
AXSUSDT LONG SIGNALS!!!!!Hi, friends. Nice to meet you.
EXY's got support now because she's above the moving average.
Long RBI in the face of an important sales!

Resistance at $19.12 is the price targetAs long as the uptrend line is not broken, the uptrend will continue. Resistance at $19.12 is the price target.

Axsusdt Formed Descending Broadening In H4 timeframe ( bulish Reversal Pattern)
Incase Of Breakout expecting 20 to 25% Bulish Move
Keep In Mind Axs Will Remain Bearish Till Wedge breakout (entry Will Be Only Valid after Breakout)

AXS IdeaIdea for ASX showing a large descending broadening wedge
I think this wedge will break out to the upside after a small pullback to a weak up trend line
This pullback and rise is shown in white
Bullish above strong trend line in thick white line


AXS: Overbought at ResistanceAxie Infinity (AXS) technical analysis:
Trade setup : Bullish breakout from Descending Triangle was confirmed with a breakout above $10 and 200-day moving average. Price is now approaching $15 resistance and is overbought (RSI > 80). The recent big move comes ahead of a negative catalyst in form of an upcoming token unlock.
Trend : Uptrend on Short- and Medium-Term basis and Downtrend on Long-Term basis.
Momentum is Bullish but extremely overbought. (MACD Line is above MACD Signal Line). RSI is bullish (> 55) but extremely overbought (> 80) which could imply that price could briefly pause or pull back if it reaches Resistance.
Support and Resistance : Nearest Support Zone is $6. The nearest Resistance Zone is $10, which it broke, then $15, and $20.

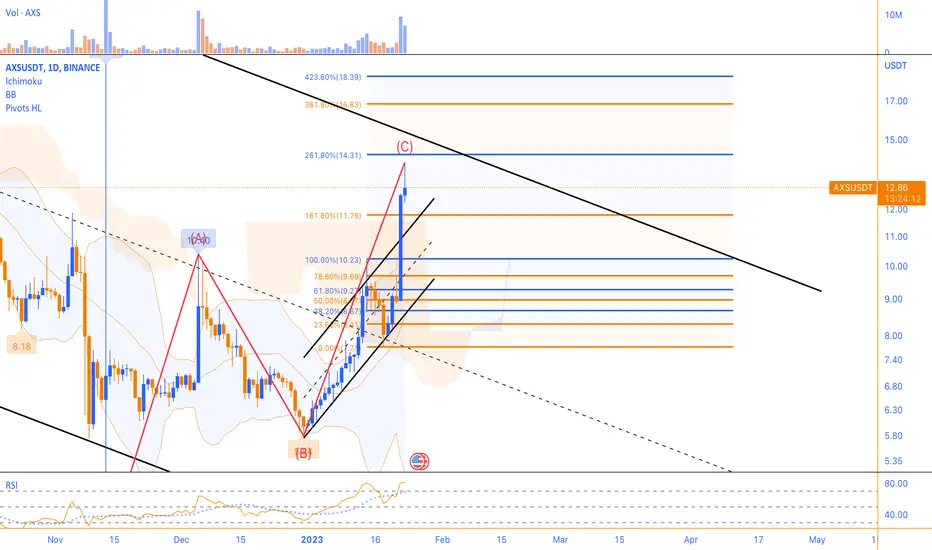
AXS broke through its important resistance in the $10 rangeIn the last 24 hours, AXS broke through its important resistance in the $10 range with a growth of more than 40%. This resistance placed exactly at the ceiling of the range channel of the daily timeframe has become a good support, and we can expect a positive reaction in the pullback to this level. Note that the price of this currency is close to the ceiling of the main descending channel, and a negative reaction has accompanied the $14.31 resistance area at the ceiling of the descending channel. If more reaction is observed, reversal patterns can be formed. But if the support of buyers continues and this resistance is broken, the possibility of a further price increase to the range of $16.83 to $18.39 will be provided. We expect a stronger negative reaction from this resistance.