Can #AXS Bulls Sustain the Momentum or Will it Fall? Key LevelsYello, Paradisers! Will #AXS finally deliver a strong upside move, or are we just seeing another setup to trap impatient bulls before a deeper drop? Let’s break down the latest #AXSUSDT structure:
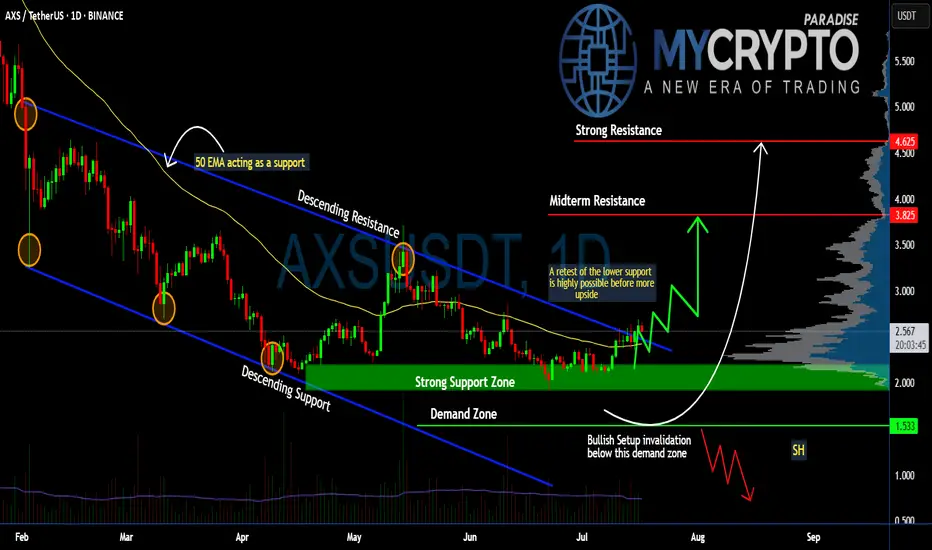
💎After months inside a descending channel, #AxieInfinity has finally broken above the descending resistance, showing early signs of a potential trend reversal. The current price trades around $2.56, but history tells us a retest of lower levels is still highly possible before any sustained upside move. The soaring volume and a positive broader market outlook reinforce our bullish bias.
💎The structure is clear: the strong support zone sits between $2.20–$2.00, and this is the first critical level to watch. A healthy retest here would provide a high-probability continuation setup for bulls. Below that, the demand zone at $1.53 is the last stronghold—losing this level would invalidate the bullish scenario completely.
💎If buyers maintain control, the first upside target stands at the midterm resistance of $3.82, where some profit-taking and selling pressure are expected. A clean breakout above this zone could push the price toward the strong resistance at $4.62, where major distribution could occur.
💎However, the bullish setup becomes invalid if #AXSUSD loses the $1.53 demand zone. A confirmed daily close below this level would flip the structure bearish and open the door for a move to new lows.
Stay patient, Paradisers. Let the breakout confirm, and only then do we strike with conviction.
MyCryptoParadise
iFeel the success🌴
AXSUSD
AXSUSDT 1D Analysis AXS ~ 1D Analysis
#AXS Buy gradually from here if you still have confidence in this coin with a short term target of at least 15%++

#AXS/USDT#AXS
The price is moving within a descending channel on the 1-hour frame, adhering well to it, and is heading for a strong breakout and retest.
We are seeing a bounce from the lower boundary of the descending channel, which is support at 3.11.
We have a downtrend on the RSI indicator that is about to be broken and retested, supporting the upward trend.
We are looking for stability above the 100 Moving Average.
Entry price: 3.16
First target: 3.23
Second target: 3.45
Third target: 3.65

AXS/USDT: Whale Driven Distribution, Shakeout, and AccumulationAXS/USDT Daily (Dec 2024–May 2025):
Price dropped from $10 to $2, driven by whale distribution and now whale accumulation at the $2–$3 levels. This is based on developing high volume node indicating high trading activity.
Whales sold into FOMO in Dec 2024, triggered panic sells during Feb–Apr 2025, and are buying at current support.
Watch for a bounce toward $5 (VWAP resistance) if volume turns green, or a drop to $2.000 if support fails.
Monitor #axs sentiment on X.com for confirmation. A call for lower prices, lack of interest, fear and general panic in the community, will signal the true bottom!

AXSUSDT 1D AnalysisAXS ~ 1D Analysis
#AXS Buy after successfully penetrating this resistant line with a short -term target of at least 10%+ from here.

AXSUSDT 1WAXS ~ 1W Analysis
#AXS If you still have a Conviction on this coin, maybe this support you can consider to start buying again from here.

AXSUSDT 6DAXS ~ 6D
#AXS Retesting this support would be a very good buying place for now,. Buy in stages with a minimum target of 20%+

Axie Infinity (AXS)🎯 Introduction
AXS (Axie Infinity Shards) is the native token of the Axie Infinity ecosystem, a popular blockchain-based game operating on the "Play-to-Earn" model. Players can earn AXS tokens by breeding, battling, and trading digital creatures known as "Axies." This token is also used in governance mechanisms, staking, and in-game transactions. The growth in AXS’s value is tied to the ongoing development of the game and its wider adoption within the cryptocurrency world.
📊 AXS Technical Analysis
Current Status:
On the weekly timeframe, AXS is in a long-term range-bound zone:
📈 Range High: Red zone (11.186 - 12.605)
📉 Range Low: Gray zone (3.840 - 4.414)
Key Support and Resistance Zones:
Daily Support: Purple zone (5.581 - 5.932)
This zone has acted as a key support level. If lost, the price is likely to fall toward the lower range (gray zone).
Daily Resistance: Yellow zone (6.910 - 7.328)
Breaking through this level could trigger a price move towards the range high (red zone).
Upcoming Scenarios:
🟢 Bullish Scenario:
If the purple support zone holds and the yellow resistance is broken:
Move towards the range high (red zone).
A breakout above the red zone will lead to price targets based on Fibonacci levels:
🎯 TP1: 20.007 - 24.056
🎯 TP2: 41.929 - 48.315
🎯 TP3: 67.896 - 77.108
Important Note: At each of these targets, profit-taking 💵 is strongly advised.
🔴 Bearish Scenario:
If the purple support zone is lost, the price may drop towards the lower range (gray zone).
🎯 Suggested Entry Points:
Break above the daily yellow resistance with a stop loss below the gray zone.
Break above the red resistance with a stop loss below the purple zone.
Indicators and Volume:
RSI:
Crossing above the midpoint of the RSI may indicate a bullish move.
Entering the Overbought region could lead to sharp upward movements 🚀.
📊 Volume Analysis:
Increased volume during resistance breaks is crucial; otherwise, there’s a higher risk of false breakouts.
📌 Summary:
AXS is currently at a critical level. Price behavior in relation to the identified support and resistance zones will determine the future trend. Effective risk management through stop-loss and close monitoring of trading volume are key to success in trading this coin. 💡
Recommendation: Always consider the overall market conditions and any related news regarding the Axie Infinity project before making trading decisions.

Axie Infinity to Surge 87%Axie Infinity (AXS) is ready to roar with a projected 87% price surge from its current level of $6.25. If it continues its current upward trajectory, we could see price reach $11.70, representing a substantial gain.

AXS-4h- Accumulation RangeAXS-4h- Accumulation Range
REMEMBER that a lot of investors sell stocks or crypto for fiscal conditions in 2024 to close the year.
For that, we have low buy liquidity , and even with that pressure on the price , AXS is trying to remaning in the same range as 1 week ago, so a breakout can restart a new HH , so patience.
Im bullish on AXS if 7.0 will be broken and confirmed as support.

#AXS/USDT#AXS
The price is moving in a descending channel on the 1-hour frame and is expected to continue upwards
We have a trend to stabilize above the moving average 100 again
We have a descending trend on the RSI indicator that supports the rise by breaking it upwards
We have a support area at the lower limit of the channel at a price of 6.71
Entry price 6.73
First target 6.90
Second target 7.06
Third target 7.20

$AXS SHORT IDEA
After the desired growth, the AXS coin is now in a resistance zone. Based on the movements of Tether dominance and Bitcoin dominance, I decided to open a short position on this coin. Target and stop-loss information is in the image. I hope it brings good profit.

#AXS (SPOT) entry range(4.170- 5.150) T.(9.190) SL(4.096)BINANCE:AXSUSDT
entry range (4.170- 5.150)
Target1 (6.660) - Target2 (8.370)- Target3 (9.190)
1 Extra Targets(optional) in chart, if you like to continue in the trade with making stoploss very high.
SL .1D close below (4.096)
*** collect the coin slowly in the entry range ***
*** No FOMO - No Rush , it is a long journey ***
**** #Manta ,#OMNI, #DYM, #AI, #IO, #XAI , #ACE #NFP #RAD #WLD #ORDI #BLUR #SUI #Voxel #AEVO #VITE #APE #RDNT #FLUX #NMR #VANRY #TRB #HBAR #DGB #XEC #ERN #ALT #IO #ACA #HIVE #ASTR #ARDR #PIXEL #LTO #AERGO #SCRT #ATA #HOOK #FLOW #KSM #HFT #MINA #DATA #SC #JOE #RDNT #IQ #CFX #BICO #CTSI #KMD #FXS #DEGO #FORTH # AST #PORTAL #CYBER #CLV #RIF ENJ #ZIL #APT #MAV #ZRX #ID #AXS ****

AXSUSDT Rectangle PatternAXSUSDT Breaks Out of Rectangle PatternAXSUSDT Technical Analysis update
AXSUSDT has formed a rectangle pattern at the bottom near its major yearly support level. The price has broken the rectangle pattern resistance on the daily chart, indicating a potential bullish move from the current level. The price is trading above the 100 and 200 EMAs on the daily chart, with a noticeable rise in volume in recent candles is also considered strongly bullish.

AXSUSDTAXS ~ 1W
#AXS Continuing to maintain this support block,. If you still have Conviction on this coin. This support block would be a very good buying place for now. at least for a 20%++ increase in the short term.

AXSUSDT Bulls Take Control! Key Levels in Sight.Analysis for AXSUSDT 15m Timeframe – Long Trade
Current Position:
Entry: $4.677
Current Status: Target 1 (TP1) at $4.823 has been successfully achieved. Awaiting further momentum to hit higher targets.
Technical Overview:
Risological Dotted Trend Line: The upward curve of the trend line indicates positive momentum and a strong bullish sentiment in this timeframe.
Volume Analysis: Current volume stands at 1.03M, lower than the 30-day average of 1.91M. Despite the lower volume, the price has sustained its upward trajectory, suggesting underlying buying interest and potential accumulation.
Key Performance Metrics:
Short-Term Weakness: The asset has shown negative returns over the last 1 week (-5.63%) and 1 month (-9.62%), reflecting recent downtrends.
Long-Term Resilience: Despite the short-term declines, AXS has a slight positive return over the past year (+2.12%), indicating resilience in its long-term outlook.
Target Levels:
TP1: $4.823 (Achieved)
TP2: $5.060
TP3: $5.296
TP4: $5.442
Stop Loss (SL): Placed at $4.559, providing a balanced risk-to-reward ratio for this trade setup.
Outlook: The trade remains bullish, with further targets potentially reachable, provided AXSUSDT can maintain momentum. Keep an eye on volume trends for additional confirmation of sustained buying pressure.
This setup aligns well with a continuation in the bullish trend, leveraging favorable price action to target the next levels.

#AXS/USDT#AXS
The price is moving in a descending channel on the 12-hour frame and is sticking to it very well and is about to break upwards
We have a bounce from the lower limit of the channel at a price of 4.00
We have an upward trend on the RSI indicator that is about to break, which supports the rise
We have a trend to stabilize above the moving average 100
Entry price 4.80
First target 5.80
Second target 6.40
Third target 7.17

#AXSUSDT On the Edge of a Major Breakout From Descending ChannelYello, Paradisers! Are you ready for what could be a game-changing move in the #AXS market? Let's look at the latest analysis of #AXSUSDT:
💎We're closely monitoring the strong potential for a bullish continuation from a critical support zone at $4.47. For those tracking #AXS, the signs are clear—#AxieInfinity is gearing up for a breakout from the descending channel formation, and it could happen soon.
💎Currently, NYSE:AXS is following a descending channel pattern, and a breakout from this structure could send prices soaring. The first key target after a breakout is the minor resistance at $6.01. If #AXS holds steady above $6.018, we could be on the verge of a significant rally.
💎Historically, we’ve seen explosive moves like this, and a breakout above the critical $7.63 resistance could pave the way for even higher resistance zones.
💎But if momentum weakens near this key demand zone, we could witness a pullback to the lower demand area around $3.82. A daily close below $3.82 would invalidate the bullish setup and open the door to further declines.
Stay focused, patient, and disciplined Paradisers.
MyCryptoParadise
iFeel the success🌴

AXSUSDT Forms Bullish Falling Wedge PatternAXSUSDT technical analysis update
AXS is moving towards the wedge resistance trendline, signaling a potential breakout. Once the breakout is confirmed on the daily chart, we can expect a strong bullish move in AXS.
Regards
Hexa

AXSUSDTAXS ~ 1W
#AXS If you have Conviction on this coin,. You should get a good price to start buying from here.

AXSUSDT Axie Infinity 1W-TIMEFRAME ANALYSIS💥AXSUSDT Axie Infinity 1W-TIMEFRAME ANALYSIS
💗Hello ladies and gentlemen
This is my new idea for 💥AXS Axie Infinity
I hope my idea is clear
Support me by like and share thank you
Stay Safe💯💲💲💲
Good luck💰😍


Axie Infinity: Seems extremely bullish!AXS is now down almost 96% from its previous ATH and is about to reach an important support level, which is a strong demand zone at $4. It can recover to its ATH of around $164, and if there is significant hype and AXS performs exceptionally well in the upcoming bull run, hitting targets above $1,000 is not impossible, IMO.
