Axie $AXS how long can the Ron bridge hold you? Axie AXS, Axie AXS how long can the Ron bridge hold you from falling
With 600m lost... How long can you stand tall.
Fall u must when bridge re-opens
Fall u shall when bridge flows
Let's c...
NAF DYOR
AXSUSD

💡Don't miss the great buy opportunity in AXSUSD @AxieInfinityTrading suggestion:
". There is a possibility of temporary retracement to the suggested support line (66.73).
. if so, traders can set orders based on Price Action and expect to reach short-term targets."
Technical analysis:
. AXSUSD is in an uptrend, and the continuation of the uptrend is expected.
. The price is above the 21-Day WEMA, which acts as a dynamic support.
. The RSI is at 60.
Take Profits:
TP1= @ 74.56
TP2= @ 79.67
TP3= @ 84.25
TP4= @ 90.96
TP5= @ 97.94
SL= Break below S2
❤️ If you find this helpful and want more FREE forecasts in TradingView
. . . . . Please show your support back,
. . . . . . . . Hit the 👍 LIKE button,
. . . . . . . . . . Drop some feedback below in the comment!
❤️ Your support is very much 🙏 appreciated!❤️
💎 Want us to help you become a better Forex / Crypto trader?
Now, It's your turn!
Be sure to leave a comment; let us know how you see this opportunity and forecast.
Trade well, ❤️
ForecastCity English Support Team ❤️

💡Don't miss the great buy opportunity in AXSUSD @AxieInfinityTrading suggestion:
". There is a possibility of temporary retracement to the suggested support line (66.73).
. if so, traders can set orders based on Price Action and expect to reach short-term targets."
Technical analysis:
. AXSUSD is in an uptrend, and the continuation of the uptrend is expected.
. The price is above the 21-Day WEMA, which acts as a dynamic support.
. The RSI is at 62.
Take Profits:
TP1= @ 74.56
TP2= @ 79.67
TP3= @ 84.25
TP4= @ 90.96
TP5= @ 97.94
SL= Break below S2
❤️ If you find this helpful and want more FREE forecasts in TradingView
. . . . . Please show your support back,
. . . . . . . . Hit the 👍 LIKE button,
. . . . . . . . . . Drop some feedback below in the comment!
❤️ Your support is very much 🙏 appreciated! ❤️
💎 Want us to help you become a better Forex / Crypto trader ?
Now, It's your turn !
Be sure to leave a comment; let us know how you see this opportunity and forecast.
Trade well, ❤️
ForecastCity English Support Team ❤️

AXS is preparing to launch to 80-95 usd maybeNice support of white SMA, i am taking the risk here... but we need to be careful as new quarter is here... lets see....be patient with entry. Laddering always! :) Good luck guys.
NOT FINANCIAL ADVICE

Axie Outlook 1D TimeFrameAxie now has a bullish potential after break out the bearish channel last week, and now we look a bullflag pattern.
next target at the Fibonacci support area $90.5

AXS - Let`s go!Thing it`s the last chance to get on the AXS train for super nice gains today! What do you think?
DOYR!
Happy Trading

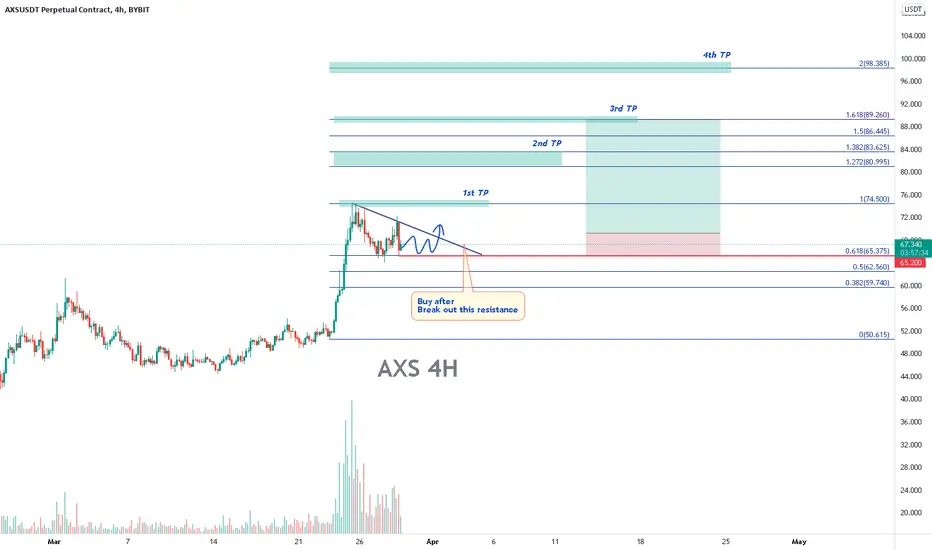
AXS - Buy it when break out this lineBYBIT:AXSUSDT
4H trend chart
-
AXS is consolidating and converging.
It's good for it to accumulate around $65
If price can break out the downtrend line, trading strategy as bleow.
-
Profit Targets:
a) 74.5----Fib(1)
b) 80.995~83.625----Fib(1.272~1.382)
c) 89.260----Fib(1.618)
d) 98.385----Fib(2)
Stop losses:
a) 10.882-----Red horizontal ray
-
If you like this analysis, smash the "like button" and leave a comment below to share your thoughts
or let me know what crypto you want to see!
Trading is a reflection of yourself. Learn more daily and be ready for every opportunity.
Have a nice trading!
buy AXS
Given the range of support can be a good opportunity to buy. In fact, the pullback is on the rise. Buy step by step with low lever. It is possible to modify bitcoins. Be sure to observe the loss limit.

AXSUSDT - SETUPAXSUSDT price is moving in a rectangular box and now bulls chase again the top of that zone and they are looking aggressive in this area. If they sustain the move they can easily move towards the next resistance level.

AXSUSDT-LONGBased on technical factors there is a long position in :
📊 AXSUSDT Axie Infinity
🔵 Long Now 69.26
🧯 Stop loss 63.93
🏹 Target 1 78.48
🏹 Target 2 91.91
🏹 Target 3 111.11
💸Capital : 1%
We hope it is profitable for you ❤️
Please support our activity with your likes👍 and comments📝


$AXSUSD - Symmetrical triangleHello everyone!
symmetrical triangle spotted on AXSUSD chart, the path on the chart is an estimate, wait for a breakout above $67.8

AXS/USDTesting/tracking elliot wave theory. Please do not trade off idea without S/L. Not financial advice.
Link to previous chart:
The counts were a bit off; wave 5 top was a lot lower and we've been correcting since then. The bottom also went a lot lower than predicted. We should be moving back up to the bigger wave (3) cycle.

AXS Bullish SoonAXS looks to have completed it's bearish impulse move with wave 5 (Feb 7-Feb 23) being confirmed with 5 fractal sub waves being counted inside.
Waiting to see how the market is on Monday before picking up this setup but I'm watching for bids around $46-47.

Bearish on $AXS for near $11 #AXS #AXSUSD $AXSUSDBearish on AXS for near $11
* Aladdin already called bearish on this one long time ago
* Alongside the market this may slowly fall and rest in peace near the demand zone as shown. It may have some potential in next cycle

AXS MASSIVE PUMP!!!AXS managed to pump for almost 50% after the breakout. And looking at the Stochastic RSI in the weekly timeframe indicates that Axs has much more room to go higher.

Axie infinity got a triple bull storm brewing. Much like ethereum, Axie Infinity has an Adam and Eve double bottom, a larger standard double bottom, and an inverse head and shoulders all rolled into one. Unlike the ethereum inverse head and shoulders, the one here on axie may not be valid as it does appear that the right shoulder has a slight wick lower than the wick of the head…but if the inv h&s pattern on this one is not valid, we should still reach its target and beyond on the way to both of the double bottom targets… unless of course some major black swan event were to occur and cause a massive sell off. Barring that, probability is favoring the bulls on this one. *not financial advice*


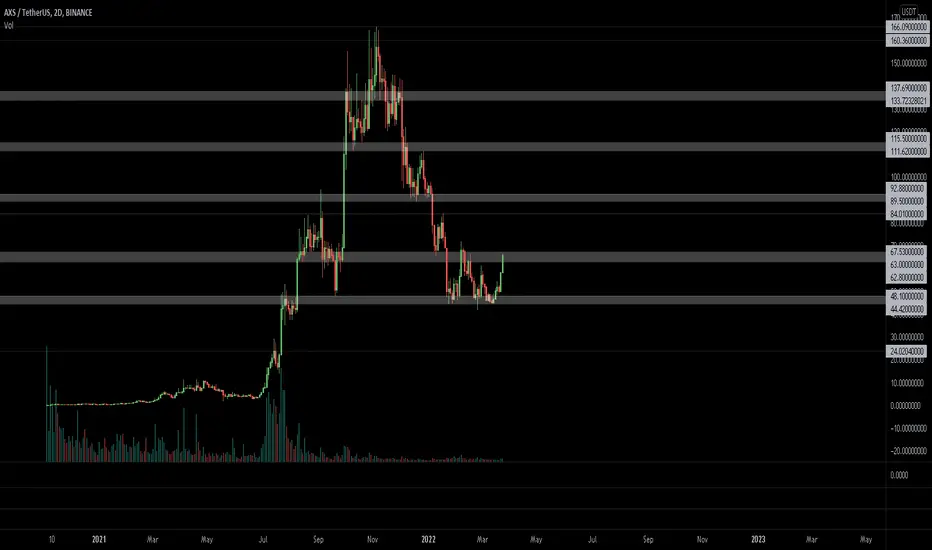
AXSUSDT - Weekly Technical Analysis UpdateMidterm forecast:
While the price is above the support 37.6000, beginning of uptrend is expected.
We make sure when the resistance at 91.0875 breaks.
If the support at 37.6000 is broken, the short-term forecast -beginning of uptrend- will be invalid.
Technical analysis:
There is a divergence in RSI and price between the trough at 44.42 on 2022-01-24 and the trough at 41.9 on 2022-02-24, the probability of downtrend continuation is decreased and the probability of beginning of uptrend is increased.
The RSI resistance #1 at 51 is broken, so the probability of beginning of uptrend is increased.
A trough is formed in daily chart at 41.9000 on 02/24/2022, so more gains to resistance(s) 65.1427, 83.0000 and maximum to Major Resistance (91.0875) is expected.
Price is above WEMA21, if price drops more, this line can act as dynamic support against more losses.
Relative strength index ( RSI ) is 68.
Take Profits:
65.1427
83.0000
91.0875
111.6055
120.4969
138.8161
166.1540
220.0000
❤️ If you find this helpful and want more FREE forecasts in TradingView
. . . . . Please show your support back,
. . . . . . . . Hit the 👍 LIKE button,
. . . . . . . . . . Drop some feedback below in the comment!
❤️ Your support is very much 🙏 appreciated!❤️
💎 Want us to help you become a better Forex / Crypto trader?
Now, It's your turn!
Be sure to leave a comment; let us know how you see this opportunity and forecast.
Trade well, ❤️
ForecastCity English Support Team ❤️

AXSUSDT - Weekly Technical Analysis UpdateMidterm forecast:
While the price is above the support 37.6000, beginning of uptrend is expected.
We make sure when the resistance at 91.0875 breaks.
If the support at 37.6000 is broken, the short-term forecast -beginning of uptrend- will be invalid.
Technical analysis:
There is a divergence in RSI and price between the trough at 44.42 on 2022-01-24 and the trough at 41.9 on 2022-02-24, the probability of downtrend continuation is decreased and the probability of beginning of uptrend is increased.
The RSI resistance #1 at 51 is broken, so the probability of beginning of uptrend is increased.
A trough is formed in daily chart at 41.9000 on 02/24/2022, so more gains to resistance(s) 65.1427, 83.0000 and maximum to Major Resistance (91.0875) is expected.
Price is above WEMA21, if price drops more, this line can act as dynamic support against more losses.
Relative strength index (RSI) is 68.
Take Profits:
65.1427
83.0000
91.0875
111.6055
120.4969
138.8161
166.1540
220.0000
❤️ If you find this helpful and want more FREE forecasts in TradingView
. . . . . Please show your support back,
. . . . . . . . Hit the 👍 LIKE button,
. . . . . . . . . . Drop some feedback below in the comment!
❤️ Your support is very much 🙏 appreciated!❤️
💎 Want us to help you become a better Forex / Crypto trader?
Now, It's your turn!
Be sure to leave a comment; let us know how you see this opportunity and forecast.
Trade well, ❤️
ForecastCity English Support Team ❤️

$AXS, 30% over the last 48hs$AXS
If BAYC is the blue chip of the NFT, then AXS is the blue chip of the crypto-games?
30% over the last 48hs & showing a new UCTS 2D Buy signal (has to close)
Volume making HHs. If manages to hodl/flip this area, then aiming for ~90$
#AXS
AXIE INFINITY! THE $50 SUPPORT LEVEL WORKED OUT.Since November 2021, we have seen most cryptos and altcoins, even Bitcoin concede downtrend movements..
Price has continued to move to the downside here on AXS, but the support level at $50 has been holding strong so far.. We've seen price bounce multiple times from this key level.
Would we see a bullish rally?
Well, we might want to wait for uptrend structures to confirm a bullish rally. But we must understand that "buying the dip" is important at this time.
The all-time high is priced around $163, so picking up AXSUSDT here at $50-$60 is really reallyyyyyy cheap, basically at a discounted price.. I'm long on AXS. I'll be waiting for a new ATH.

AXS only for risk takersWaiting for reversal here... there might be some bounce 30-70%. This one is risky because if green support break down... we can see lower prices...smaller position here.
NOT FINANCIAL ADVICE
POSTING ONLY FOR EDUCATIONAL PURPOSE
