AXIES DUMP INFINITY PONZI COLLAPSEAxie Infinity is a pyramid scheme collapsing.
That's a Ponzi in the collapse phase. Their Smooth Love Potion token is down 90% and in a screaming dive, and their Axie token is down more than 90% from peak. That one is going to hurt a lot of poor people in the Philippines. Many quit their jobs to play Axie's play-to-earn game. All the money comes from later entrants, so it's a Ponzi by definition.
Stay safe
AXSUSDT

AXSI think that the possibility of a downward z wave after the end of a bearish triangle is strong. The end of this bearish channel that I have drawn may not be a bullish harbinger for us. I think it will give us better clues about the criterion of the behavior here.

AXS/USDT - SHORT----- Welcome, dear followers! -----
- Here is my trading methodology. I trade with a normal system and analysis of resistance and support, as well as price reversal patterns.
- For the record, I do not place a stop loss within my trades. So that I only risk 1.5% of my total capital in order to support the loss due to a price reversal against me.
- If a price reversed against my expectation and touched the drawn line r3, then I transferred targets to the entry point and waited for the price to close at it with a loss equal to almost zero.
- Today's deal is shown in the chart, and here are the entry and exit points below.
-- Support me with numbers and follow up on my account for other deals in the future. Thank you for coming to this part. --
-------------------------------------------------------
⚡️⚡️ AXS/USDT ⚡️⚡️
Exchange: Binance Futures
Trade Type: Regular (Short)
Leverage: Cross (1.0X)
Entry Orders:
1) 12.4 - 100.0% (62 USDT)
Take-Profit Orders:
1) 12.15 - 80.0%
2) 11.88 - 19.999%
Trailing Configuration:
Stop: Breakeven -
Trigger: Target (1)

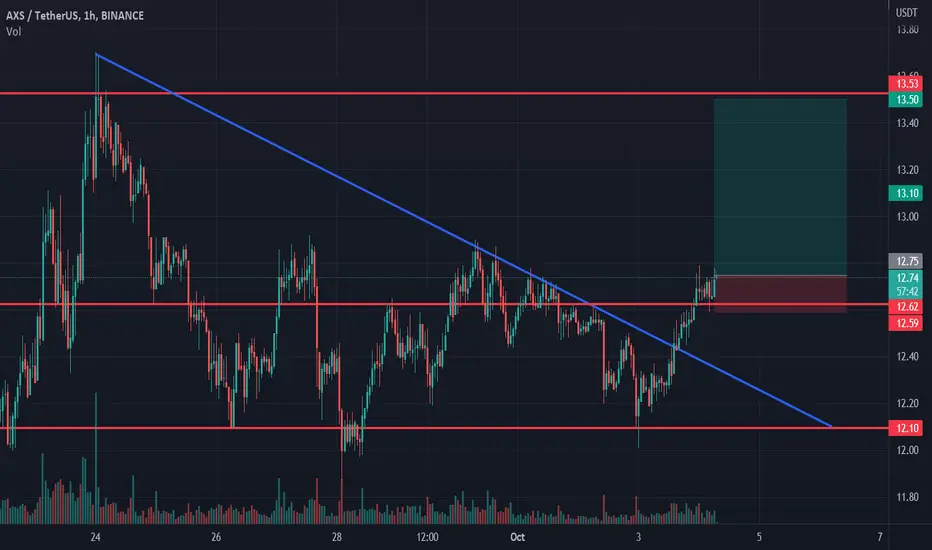
AXS - Further Upside?AXS recently broke the descending trendline on the 1H time frame.
Is there room for further upside? if current levels hold, yes, given that we sit at multi-month lows.
Keep an eye on the trendline at this stage which act as a new support for further price action

Axie Infinity longAxie Infinity broke trough the descending trendline. Asset broke trough the resistance level. Bullish movement to resistance level at 13.5 is expected to happen.
Is AXS about to finish his bearish trend?Even I checked multiple high timeframes I just saw too much important support and resistances near to current zone, but bearish flag pattern is not finished yet which makes me doubt about if bearish trend will finish soon or not, so I think that I need to check closely BOS and CHoCH in order to confirm. Also we can see in chart that squeeze momentum is pointing to bullish.

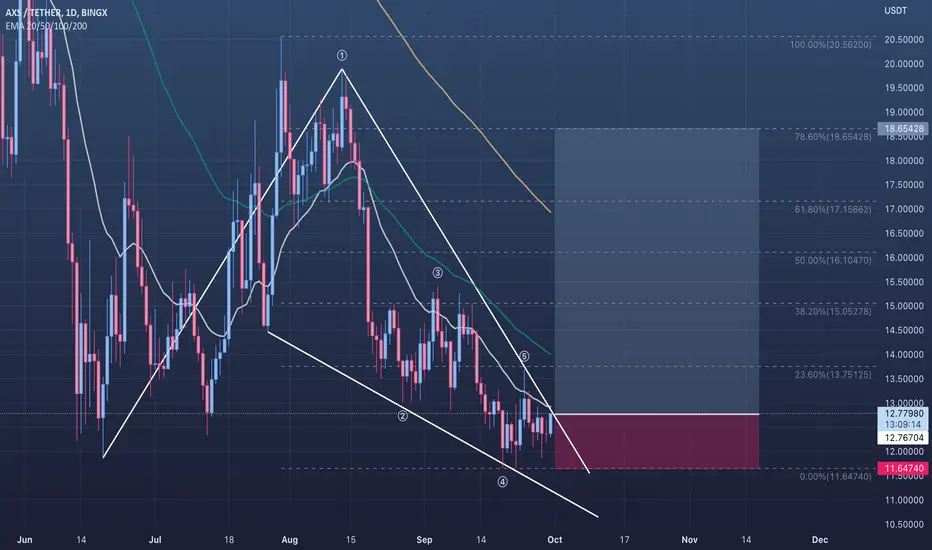
🟢 AXSUSDT - 1D (30.09.2022)🟢 AXSUSDT
TF: 1D
Side: Long
Pattern: Bull Flag / Falling Wedge
SL: $11.64740
TP 1: $13.75125
TP 2: $15.05278
TP 3: $16.10470
Nice bull flag / falling wedge on AXSUSDT.
Should be looking to break out soon.
Buy now and DCA or wait for price to reach the red area.
🚩🔥 My favourite trading pattern: Axie trendline breakout!📊 Hi friends! AXS moving in a massive falling wedge. Now the price is close to the global trendline. The squeeze to the global trendline confirms us the pressence of buyer. This is a good place to open a long with nice RR.
Every time when the price reach the bottom, the volume bars are growing which mean the pressence of buyers. They want to buy the altcoins lower to sell at higher price.
📊 I see the next preconditions to open a long:
🚩 squeeze to the trendline before the breakout
🚩 DOM and Footprint orders to buy as the support of the price
🚩 BTC push the price of the Axie to the our targets✅
🔥 It would be nice to see the price breakout of the key level of $12. Addtionally the volume should grow and confirm this trap.
✅ The targets:
1. $14-14.5
2. $18-18.5
💻Friends, press the "boost"🚀 button, write comments and share with your friends - it will be the best THANK YOU.
P.S. Personally, I open an entry if the price shows it according to my strategy.
Always do your analysis before making a trade.

AXSUSDT- SHORThello back guys!
we back again with new ideas
here AXS/usdt I thing we will go short cuz we break channel down
we have
tp1
tp2 as targets
and stop lose is mental in 1R
I don't Use stop lose if price go and touché 3R line I will move Tps In entry price and with from price come back and close with 0 lose
if price go more than 6 month and don't come back to entry price I will close it with lose.
good luck guys
⚡️⚡️ AXS/USDT ⚡️⚡️
Exchange: Binance Futures
Trade Type: Breakout (Short)
Leverage: Cross (1.0X)
Entry Orders:
1) 13.33 - 100.0% (156.72 USDT)
Take-Profit Orders:
1) 12.62 - 80.0%
2) 11.91 - 19.999%
Trailing Configuration:
Stop: Breakeven -
Trigger: Target (1)

ETH DROP IS EXPECTEDI think eth is going to make another tap to the support area, and the candles looking bearish, better to stop long positions and wait for the next tap to be formed before opening long positions...

#AXSUSDT#AXSUSDT
If axs can break down the trend line ( red line ), next target will be 20$ .
and if stay bellow this trend 12$ is next support


LTCUSDT | SYMMETRICAL TRIANGLELTCUSDT has been trading in a triangle. The price is trading near to trendline resistance. We are expecting a bullish breakout above the triangle.
The bulls need to break above the triangle, While bears will be in control below the falling resistance.
Manage your trades accordingly.

🔥AXS make a huge pullback: where to entry to not miss the PUMP?Hi friends! I give you 1 useful tip to increase your trading results. Always pay atention to the volumes growth. It will help you to identify the potential reversal points, where you open the bes trades with good sl and tp.
Check the last 2 traps that happen on AXS. Do you see how the volume growth on the both traps (false breakouts) for short and long? There are the best setups for the scalpers and swing trading. Pay the atention to such situations close to the important levels, huge value areas.
📊 Preconditions to open a long:
🔥 squeeze to the trendline
🔥 no resistance on DOM and Footprint only big buy orders. Also if u use such tools you can see how thw large sell limit waals are desapear beacause of huge amount of buyers
🔥 bullish BTC help the AXS to reach the 3 targets faster
🚩 It will be nice to not have the volume growth when the price reach cosest targets and resistance. It will be some bearish signals. If the we will have just avsarage volumes, that is mean the big players are still not sell all their coins.
📊 The targets for long:
1. $15 - the key level, closest target
2. $18-19 - the closest value area
3. $20-21.5 - the value area
💻Friends, press the "boost"🚀 button, write comments and share with your friends - it will be the best THANK YOU.
P.S. Personally, I open an entry if the price shows it according to my strategy.
Always do your analysis before making a trade.

bullish on AXSI have just happened to see this channel on axis and it seems very nice. this is a place where I would look for entries for a swing position.

AXSUSDTHello my dear friends
Four-hour chart: the probability of completion of the head and shoulders pattern at the end of the downtrend
Provided that the end of the upward trend and the price range of $12.99 is maintained, there is a possibility of forming an increasing trend up to the specified ranges.
If the current trend is above the price range of $15.77, there is a possibility that the trend will advance to the yellow range ($16.77).
We would be happy to hear your comments

Axie Infinity (AXS); when to buy?The resistance level with the upper border of $15.02 was broken on the Daily price chart on September 3. The trend is bullish now and the correction wave develops.
A pullback buying opportunity will appear after the correction completion on the Daily timeframe.
The highs of September 3 – 5 will be the target for the bullish movement continuation after the correction is finished.
In case of successful development of the trend, a more distant target will be on the highs of August 12 – 15, where the next resistance is located with the borders of $19.23 – $19,90.
Long positions will remain relevant until the market is above the nearest support level on the Daily timeframe, the lows of August 26 – 30 . The borders of this support are $13.0 – $13.15.

DAY 3: #AXSUSDT #LONGDAY 3: #AXSUSDT #LONG
2% of the deposit
Margin: isolated
⚖️Leverage: x10-20
🗝Entry point: 14.00-14.12
🎯target 1 - 14.39
🎯target 2 - 14.67
🎯target 3 - 15.08
🎯target 4 - 15.53
🎯target 5 - 16.09
❌stoploss: 13.50

Axie Infinity shortAxie Infinity broke trough the ascending trendline. Asset broke trough the support area. Bearish movement to support level at 13.1 is possible.
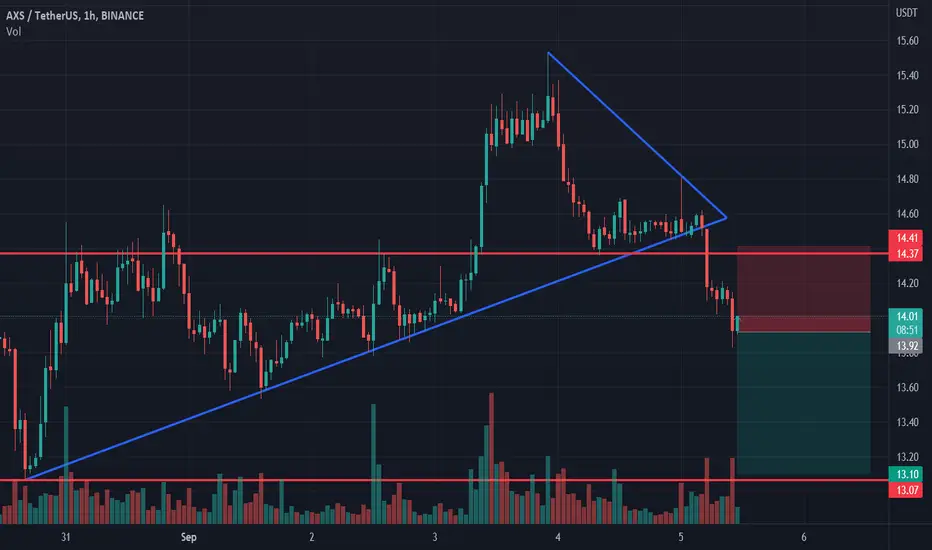
AXS short$AXS bounced off the resistance level. Decline to support level at 13.06$ is likely to happen.

AXS prints a triple bottom patternIf you look at the 4h time frame chart of AXS you can clearly see that it successfully completed and confirmed the triple bottom pattern breaking out the resistance line.
I will consider to wait for a pullback and enter a long at 14.02$ with an stop loss at 13.43$ and i will take profits at 16.62$.

Axie Infinity longAxie Infinity broke trough the descending trendline. Asset broke trough the resistance level. Bullish movement to resistance level at 15.1 is expected to happen.

AxsusdtHello friends. I see two patterns. A twin floor, Adam and Adam. And a descending triangle, in any case, breaking the 13.90~14 resistance could be the start of an upward movement. Share your opinion with me.
