Axie Infinity AXS/USDT : Recovery expected towards 119,00Axie Infinity AXS/USDT : Recovery expected towards 119,00 (Update)
Axie Infinity is a blockchain-based trading and battling game that is partially owned and operated by its players.
The Axie Infinity ( AXS ) token is an ERC-20 token launched on the Ethereum blockchain. As a result, it is secured by Ethereum’s proof-of-work (POW) consensus mechanism.
Previous Analysis :
10/02/2022 :
Context
AXS /USDT has been listed in the middle of the last year, so the historical data are not really mature for a deep target projection. However Focusing on Daily and 3H basis we can already highlight key technical elements to understand the actual picture
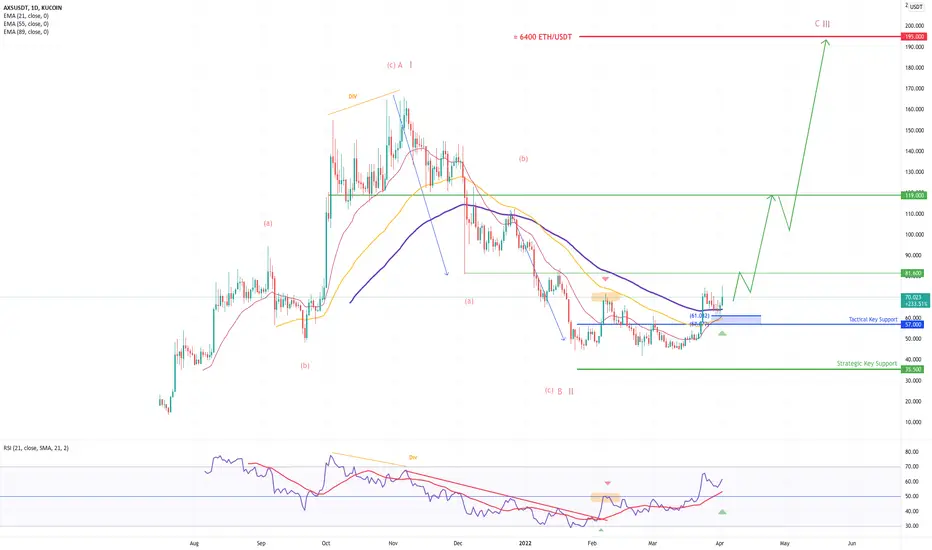
For now the initial raise can be describe in 3 wave up move (Corrective - A/) or 5 wave up move (Impulsive I/) - depend if you switch the scale between lin or log, on my side i would be more confortable with an impulsive move at this stage. So once that it said and as i described on the chart, the following move (down leg) has been done in 3 wave down (A-B-C corresponding to a logic corrective move in wave B/ if we are in ascending range towards 195.00 and more if we are in a impulsive long-term trend - it what we are calling a ''common part'' between to different scenario)
So the configuration is quiet nice because the wave A = Wave C and the market bounced off 50/61,8 retracement which are standard to respect a proportion for this kind of Harmonic / elliot wave pattern, the determinism of the behavior behind the scene is strong a significant rise is clearly more likely.
Tactical view (1 to 3 weeks)
As you can see for now the RSI and the 55/89 EMA provide a clear bullish signal, all the EMA are acting as support now . This setup is strongly bullish and will be clearly validated by surpassing 81,60 (upside confirmation level).
As long as 57 remains key tactical support ( Pivot ) a direct rise is more likely towards 81,60 before 119,00
else penetrating 57 a test of 35,50 Strategic key support ( Pivot ) will occur before any bullish tentative
Also i recommand to have a look on SLP /USDT which is also a native ERC20 coin connect to Axie ecosystem, -analysis here =>
Enjoy my friend ! and support me please by activating your referal code for the app we built with my team (Get 200 EUR in AKTIO COIN) Link in my signature below ;)
AXSUSDT
Axie Infinity (AXS) Buy ZoneAxie Infinity (AXS) Buy Zone
--------------------
BIAS
Mid-Term : Bullish
Risk : High
On 4 hours timeframe Axie Infinity formed bullish pattern which shows the possible reversal at $29 zone.
--------------------
$AXS/USDT LONG SETUP
Leverage : x3 - x5
Entry Price : 28.8 - 27.9
TP 1 : 31
TP 2 : 32.5
TP 3 : 33.9
TP 4 : 35.25
TP 5 : 37.8
TP 6 : 39.75
TP 7 : 42.4
TP 8 : 46
Stop Loss : 26.5
*Maximum 3% of Portfolio.
*Unload 12.5% at each TP. Whenever TP 2 hits, Move stop loss to entry.
--------------------

X100 Potential In The Next Cycle!Epik Prime is an epic coin.
With more than 300 video gaming clients, Epik is the leading global NFT licensing technology company putting brands into video games to produce premium digital items and experiences for over one billion gamers worldwide with the largest digital ecosystem with hundreds of the world’s most popular entertainment brands.
Epik is widely considered to be the blockchain industry leader producing collaborations for premium licensed digital collectables, NFTs and exclusive experiences powered by an interoperable proprietary cross-chain technology.
Epik was the first and only NFT company to do any deals with AAA gaming companies for NFTs. Clients include ViacomCBS, Warner Music, Garena, Tencent and Universal.
Also Epik Prime is the part of Animoca Brand portfolio which consist many projects that had insane rallies in the previous cycle such as,
Sandbox
Axie Infinity
Flow
And now Apecoin!
Animoca Brands has insane connections.
Couple months ago they got funded by George Soros and their valuation rised to 5b USD!
This company will be one of the leading crypto portfolio companies in the future and Epik has a wide range of use.
FOr example they are branding NFTs in Sandbox and Axie Infinity for huge companies.
Epik have a huge upside potential for the next cycle!
Right now 4 cent seems to be bottom and a pretty good buy zone for Epik!

axs/usdtif breake ..
.
This Analysis will be updated ...
⚠️(DYOR)
If you apperciate my work , Please like and comment , It Keeps me motivated to do better

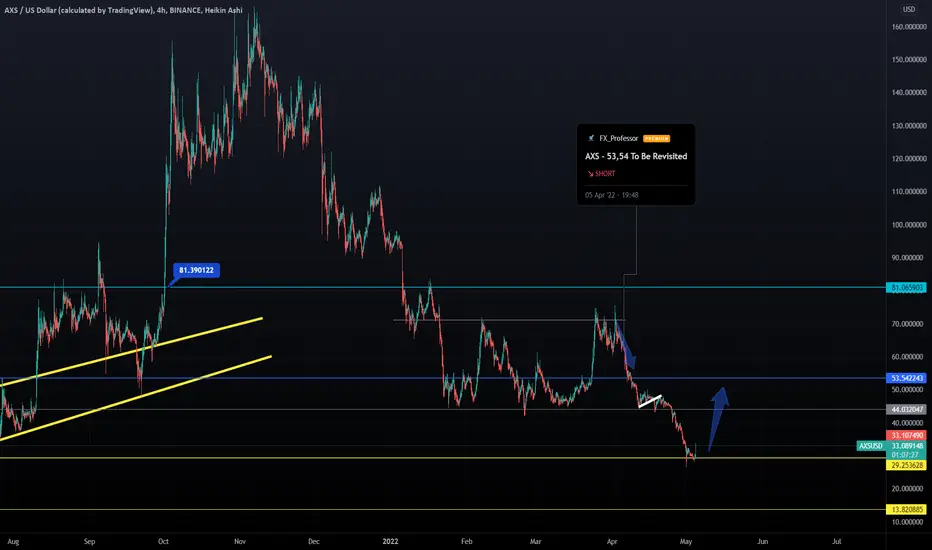
AXS - Back On The RISEAXS needed a break and to touch base with reality... and now is time for Higher
That's our chart saying, not sure about the fundamentals and all but Play to Earn sounds like a winner.
Have some fun and read this now : ''My brief wondrous life as an Axie Infinity gamer''
Crypto rookie Joel Stein dives into Axie Infinity and the curious economics of ‘play to earn.’ Will his teenage gaming dreams come true?
''Of course I want to play to earn. I want to earn money doing all the things I enjoy. Eat to earn? Sure. Watch TV to earn? I’m in. Sex to earn? Historically that’s had complications, but I’m confident that the blockchain can work those out. ''
REF: forkast.news
One Love,
the FXPROFESSOR
Trading opportunity in AXSUSDTBased on technical factors there is a long position in :
📊 AXSUSDT Axie Infinity
🔵 Long Now 32.80
🧯 Stop loss 26.00
🏹 Target 1 37.00
🏹 Target 2 45.00
🏹 Target 3 61.00
💸Capital : 1%
We hope it is profitable for you ❤️
Please support our activity with your likes👍 and comments📝

AXS Quick Report AXS Quick Report
First: The currency has lost AXS.D on tradingview = it indicates that a large number of its owners have abandoned it
Second: The currency reached 20 on RSI 1D Timeframe for the first time in its history = this signal appeared in Bitcoin only 3 times since 2015, and each time it was the end of the downtrend move/bear market (2015 low + 2018 low + Corona low)
Third: the currency fell more than 80% from its ATH = a good sign that the bottom is near
Fourth: The currency appears to have one last leg wave (the fifth from the fifth from C) between 25 - 15 $ range.
Last: I expect a rising to near 100$ before declining to 10$ range
💐

AXS Quick Report AXS Quick Report
First: The currency has lost AXS.D on tradingview = it indicates that a large number of its owners have abandoned it
Second: The currency reached 20 on RSI 1D Timeframe for the first time in its history = this signal appeared in Bitcoin only 3 times since 2015, and each time it was the end of the downtrend move/bear market (2015 low + 2018 low + Corona low)
Third: the currency fell more than 80% from its ATH = a good sign that the bottom is near
Fourth: The currency appears to have one last leg wave (the fifth from the fifth from C) between 25 - 15 $ range.
Last: After that I expect a rising to near 100$ before declining to 10$ range
💐


Trade Jangka Pendek di Token Metaverse AXS BINANCE:AXSUSDT
Buy at 16.55 and sell at 19.45, kita berpotense profit 2% s.d 2,5% belum termasuk fee exchanger!
#AXS

$axs heads and shoulders We have seen heads and shoulders fail a lot but, what if this plays out. That will mean over -50% drawdown.
Act accordingly

AXS/USDT Perpetual OKxdowntrend because of btc dominance and when btc price stables the alt's go up right ? so correct my ta.
still learning and gaining knowledge unto others ideas
careful long, wait for btc to calm down
not financial advice im just a regular MF
lets get that bread
remember big fish is no a small fish. smile :P

AXSUSDTpay attention to AXS , one of the good metaverses ;) this is my idea ! if you agree like it or disagree please write your idea in comment <3

Waiting for positionAs mentioned in the previous forecast set, we received good support at $ 1900.
Currently the price chart will fluctuate between the two levels displayed.
Passing each level will indicate a continuation in the same direction.

Axie Infinity - Looks to get out for the high breakout since ..Hello trading friends,
Depending on the trend of this moment - AXIE infinity (AXS) is into the important zone for a breakout - and an interesting target could be above the 65 USD +
AXS did make some important changes at the support 40-43 trend - what makes AXS out of the level of breakdown trend.
If there is a coming time green change on market flow - AXS could show a great increase trend - At the same time, it's important to follow the BTC flow.
All that we need as traders for an uptrend coin - AXS has it - and it's only the question of this workout - time frame will learn.
Have a good time.
#this is not a trading call - manage always your risk.

Bullish Divergence + Order Block for AXSTarget is 70$. We can see a RSI bullish divergence . This shows a possible bull trend in AXS in the next few days
Orderblock indicator is also clear that possible target is 70$
We can check other indicator for conformity of this analysis.
Please DYOR and make ur own analysis. Use this only as a guide and NOT A FINANCIAL EXPERT Advise.

AXS - The way to a breakoutHello trading friends,
Most markets are still into a downtrend - and there needs more time so that the most coins could get again green - but at the same time it's crypto and things could happen in the short term - one thing is sure - there is no guarantee for any price action.
Crypto markets did learn us, that today can be green and tomorrow red, and the same for another side.
So that's why it's important to trade only with a plan, and yes sometimes it's hard, but the try should be there at last.
Back to AXS - Why this chart
This chart view is purely dependent on price action including some TA trends.
We have seen before AXS did go with BTC, as 90% of coins do when there is a breakdown trend - but there is some things that make AXS very interesting, and I think some of the traders as you could see this also, or knowing already the effects of breakout in patterns as this.
is there a guarantee that AXS will show a huge breakout? sure no - it's crypto and all is possible, but in the world, like crypto, we depend on more chance. let's say what the markets show now depending on my expectations I see AXS increasing and having a breakout coming time - it's purely a view from different study trends.
There is in most time not always a reason to buy a coin directly - some known hedge funds use the way of % view. it means when a coin increases some % depending on their counting, the coin gets interested, and of course, there are more trading ways.
For me personally also interesting to see where AXS will go - and will follow to see the effects of it, and or it will prove that the trading study and the signals that it shows are real for a breakout.
Have a good time.
@ this is not trading advice - trade only depending on your setups.

$AXS Big longshort term swing for trend break
use SL below trendline . and sell according to our own comfort
Cheers,
Nav

My analysis of goldmy dear friends
I hope you enjoy the benefits of your business
I'm glad the previous analysis was correct.
We are shutting down our sales and awaiting a new diagnostic analysis
I will notify you as soon as new money and new analysis arrive
Please introduce me to your friends and ........
Do not forget to like
be successful and victorious
Hooray ..............


AXS : When high chance for a breakout?AXS is depending on most of the study trading skills and signals on important trends for a breakout.
Since the last updates - AXS looks still not to make the expecting move
The BTC markets support most of the time the low coins, but the % price difference depends on the coin itself.
For AXS - it's important to hit at last the 47-48 USD to get the expecting breakout between 53-69 trend. between 12% and 46% is the model counting possibility.
Before that target AXS are into accumulation fase wich could change with time range.
The levels will stay still the same the 53-55 target and the 69 Target.
The above models are the expecting frames, which means there is no guarantee it will happen 100%
It's important to study all-time you trades well before entering any market.
It's always important to check the markets on all sides - markets can change all time.

$SLP Prepare for a potential bounceThe SLP showed constant improvement after that its price drops to below 0.016 and Bulls could held price above support area , currently looks ready to bouncing from the bottom supporting zone.bulls Looking for the rally if we do flip above 0.0170📈
if we lose our support zone that is between 0.01520 and 0.01590 zones , we can see more correction tooward 0.012~ 0.013.
and if the price stays above the support Zone, then we can see more bullish move to above 0.02
Setup is invalidated if Support gets lost and price move below the major support area
Happy trading 🌷

