AXS booting up....AXS resting and accumulating in a demand zone....
Find entry, sl & tp in TA
Trade safe....
NB: Patience + risk management = Winning trades
#e2kclicks #axs
AXSUSDT

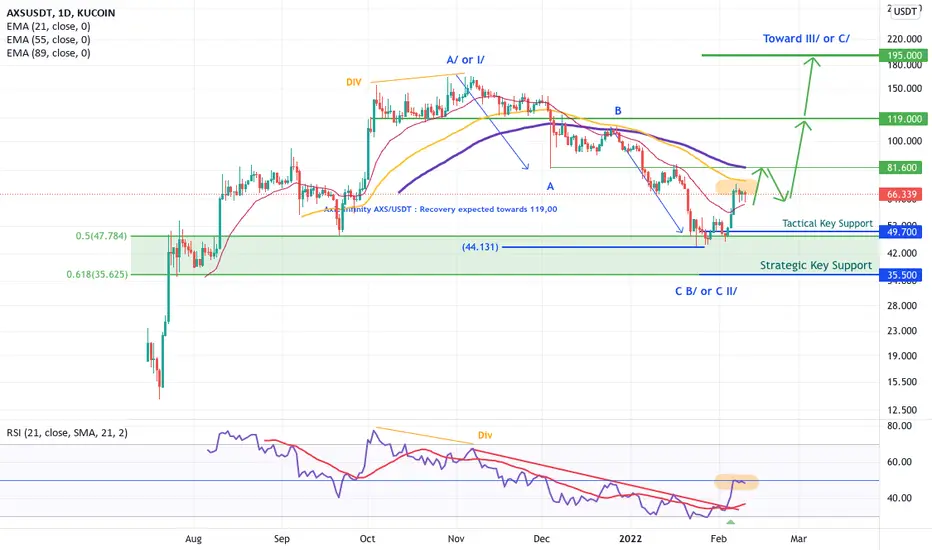
Axie Infinity AXS/USDT : Recovery expected towards 119,00Axie Infinity AXS /USDT : Recovery expected towards 119.00
Axie Infinity is a blockchain-based trading and battling game that is partially owned and operated by its players.
The Axie Infinity ( AXS ) token is an ERC-20 token launched on the Ethereum blockchain. As a result, it is secured by Ethereum’s proof-of-work (POW) consensus mechanism.
Context
AXS /USDT has been listed in the middle of the last year, so the historical data are not really mature for a deep target projection. However Focusing on Daily and 3H basis we can already highlight key technical elements to understand the actual picture
For now the initial raise can be describe in 3 wave up move (Corrective - A/) or 5 wave up move (Impulsive I/) - depend if you switch the scale between lin or log, on my side i would be more confortable with an impulsive move at this stage. So once that it said and as i described on the chart, the following move (down leg) has been done in 3 wave down (A-B-C corresponding to a logic corrective move in wave B/ if we are in ascending range towards 195.00 and more if we are in a impulsive long-term trend - it what we are calling a ''common part'' between to different scenario)
So the configuration is quiet nice because the wave A = Wave C and the market bounced off 50/61,8 retracement which are standard to respect a proportion for this kind of Harmonic / elliot wave pattern, the determinism of the behavior behind the scene is strong a significant rise is clearly more likely.
Tactical view (1 to 3 weeks)
As you can see for now the RSI and the 55/89 EMA didn't provide a bullish pre-signal, only the 21EMA is acting as support, and we have a small ''evening star doji'' capping the recovery. Those elements can call for a last down leg towards the strategic support but for now the construction of the recovery is more impulsive than corrective so those element for now stay weak within the long-term determinism on going.
As long as 49,70 remains key tactical support ( Pivot ) a direct rise is more likely towards 81,60 before 119,00
else penetrating 49,70 a test of 35,50 Strategic key support ( Pivot ) will occur before any bullish tentative
Also i recommand to have a look on SLP /USDT which is also a native ERC20 coin connect to Axie ecosystem, - i will soon published something on it
Enjoy !
YOYO - from the traders perspectiveYOYO - IDK how fundamentals are holding. This coin could be delisted in upcoming months. But from a traders perspective. RSI oversold 1D, ATL BTC pair.
RED color: Support line, ORANGE color: resistance,
GREEN color are goals: 40 satish and 60 later. cold go to 100.
I wouldn't hold this for a LONG.

Axie Infinity (AXS) - February 23Hello?
Traders, welcome.
If you "follow", you can always get new information quickly.
Please also click "Like".
Have a good day.
-------------------------------------
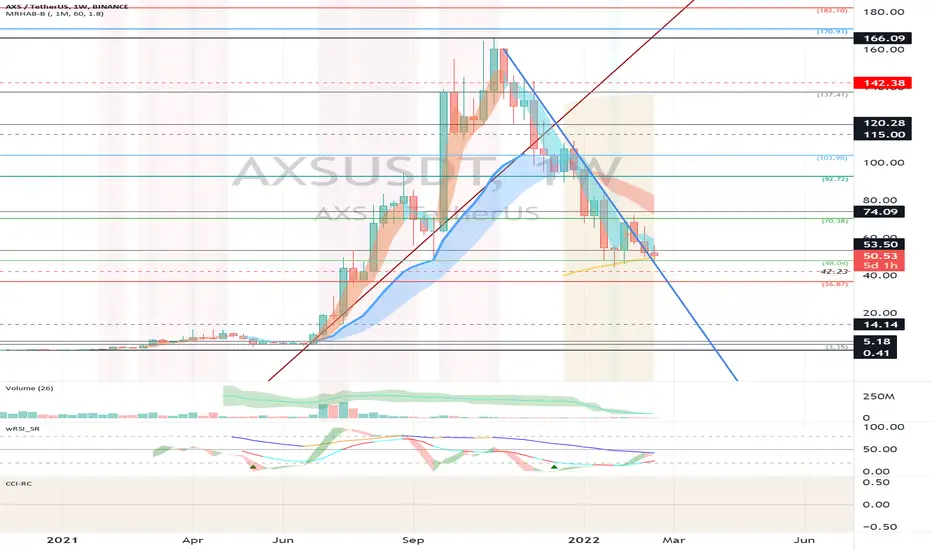
(AXSUSDT 1W Chart)
First resistance section: around 70.38
Second resistance section: 92.72-103.90
Support section: 36.87-48.04
It is important to keep the price above the 53.50 point in order to completely break out of the downtrend line.
If it goes down, you should check to see if you find support in the support zone.
(1D chart)
In the movement between February 25th - March 13th, it is necessary to check which point in the section 36.87-48.04 deviates.
If it falls below the 36.87 point, there is a possibility that it will fall near the 14.14 point, so a Stop Loss is required to preserve profit and loss.
A move above the 48.04 point is expected to lead to a move to move above the 70.38 point.
However, careful trading is required as it is expected to swing up and down to cross the M-Signal line of the 60SMA and 1W charts.
This movement is expected to occur near the 59.03 point.
-------------------------------------
(AXSBTC 1W chart)
Resistance range: 0.001906-0.002143
Support period: 0.000723-0.000960
It is important to rise above the 0.001433 point.
In particular, it should break out of the downtrend line.
Otherwise, it is expected to consolidate in the 0.000960-0.001433 section.
------------------------------------------
We recommend that you trade with your average unit price.
This is because, if the price is below your average unit price, whether the price trend is in an upward trend or a downward trend, there is a high possibility that you will not be able to get a big profit due to the psychological burden.
The center of all trading starts with the average unit price at which you start trading.
If you ignore this, you may be trading in the wrong direction.
Therefore, it is important to find a way to lower the average unit price and adjust the proportion of the investment, ultimately allowing the funds corresponding to the profits to be able to regenerate themselves.
------------------------------------------------------------ -------------------------------------------
** All indicators are lagging indicators.
Therefore, it is important to be aware that the indicator will move accordingly as price and volume move.
However, for convenience, we are talking in reverse for the interpretation of the indicator.
** The MRHAB-O and MRHAB-B indicators used in the chart are indicators of our channel that have not been released yet.
(Since it was not disclosed, you can use this chart without any restrictions by sharing this chart and copying and pasting the indicators.)
** The wRSI_SR indicator is an indicator created by adding settings and options to the existing Stochastic RSI indicator.
Therefore, the interpretation is the same as the traditional Stochastic RSI indicator. (K, D line -> R, S line)
** The OBV indicator was re-created by applying a formula to the DepthHouse Trading indicator, an indicator disclosed by oh92. (Thanks for this.)
** Support or resistance is based on the closing price of the 1D chart.
** All descriptions are for reference only and do not guarantee a profit or loss in investment.
(Short-term Stop Loss can be said to be a point where profit and loss can be preserved or additional entry can be made through split trading. It is a short-term investment perspective.)
---------------------------------
🔻 AXS short 🔻hello traders and investors.
we can open a short position if the daily candle closes below the moving average.
Disclaimer: this is not a piece of financial advice, always do your own research.

Axie Infinity shortAxie Infinity bounced off the resistance area. Asset bounced off the upper boundary of descending channel. Decline to support level at 47 is expected to happen.

Good Sign For AXS/usdt AXS showing a good u trend with good sign to go Long
Targeting 143 then 161 then 189
stoploss 1 hour close under 111 or breaking out the trend line
goodluck

Axs can pump from down of parallel?BINANCE:AXSUSDT
Keep eyes on it 👀🕵️👁️
Don't forget Financial management and step
by step purchasing 💹💰💵💲
Please fallow me 🙏🥺
Please leave comments 🗨️💬
Like and share with your friends 👍💑
I hope you enjoy ☺️🌈🎉🎊🎁

💥AXS FALLING WEDGE - TO FALL TO $45Please support this idea with a LIKE👍 if you find it useful🥳
Not a financial advice🙅🏼♂️
Right here is a falling wedge pattern with two reliable support zones on the trendline and two reliable resistance zones on the trendline.
Price just tested the inner trendline resistance zone and it’s making it way down to the lower trendline within $45 - $47.
Therefore, I expect a fall within this price range.
What do you think?
Share your opinion in the comment section✍️
Follow me stay updated about this coin and more helpful projects like this🎁
Happy Trading💰🥳🤗

Axie Infinity shortAxie Infinity bounced off the resistance area. Asset bounced down off the bearish trendline. Decline to support level at 46.15 is expected to happen.

$AXSUSDT - Inverted head and shouldersHello everyone!
I am waiting for Axie to close above this dynamic resistance. If it does close above this level, we will see AXS jump to 71 - 82 - 89

AXS cup & handle targets to 82 for first TPAXS cup & handle targets to 82 for first TP AXS cup & handle targets to 82 for first TP AXS cup & handle targets to 82 for first TP
@micdot7

AXSUSDTHello Crypto Lovers,
Mars Signals team wishes you high profits.
We are in the daily time frame. The S1 line which was previously the resistance line is broken. You can set another Buy order at this area and save your profit at the R1 and R2 lines. Always remember to save a certain amount of your profit at one resistance and the rest at the other because the price can hit the first resistance and then fall leaving you in loss. If the price goes lower than the specified area, then there would be more falling.
Warning: This is just a suggestion and we do not guarantee profits. We advise you analyze the chart before opening any position.
Wish you luck


SLPUSDT, This kind of movement can be happen after 400% profitHello everybody
According to the chart and previous analysis, the price done our TP and our VIP Membership took 400% Profit and now we think this kind of route can be happen for the price because the price should have some recovery and correction of this heavy and powerful upwards wave.
If you have any question send us messages
Good Luck
Abtin
This is our new investment plan for anyone with any amount of Capital :
Greetings to all of you dear ones and constant companions After countless reviews and requests of your loved ones based on futures signals and fixed daily and monthly profits, the management has decided to do this process and prepare the needs of your loved ones.
The new investment plans of the collection are as follows:
- Investment with fixed monthly and daily interest with low risk, which is the only risk for 50% of the capital, the risk of which is between 10% and 25%. ($ 400 to $ 1,100 guaranteed for every $ 6,000 per month)
- Investing with a fixed monthly profit with a risk of 0 to 10% for only 50% of capital (At least for every $ 15,000 $ 1,000 to $ 4,500 Guaranteed)
- Futures and crypto signals in the market with a high winning percentage (which is all managed by our team and in case of loss 50% of the loss amount will be returned to you by the team) (Minimum investment of $ 10,000 with a fee of 40% of the profit of each position)

AXS/USDTI Think AXS after a long term down Wanted to go up
absolutely after a pullback to the channel can see in the chart

AXS Elliott Wave Analysis : Will the pivot hold?Bullish scenario from last chart played out pretty good.
Looks like there was a pivot put in at that point.
But will it hold?
So a couple things of note for me when I look at this PA stand alone in a bubble.
Currently the PA is nearing an Invalidation area, once it crosses 56.60.
But I still think there is a chance that a motive wave, expanding Diagonal, could still be considered.
Another option still on the table, is a 1,2/1,2.
The 3rd short term bullish option would be that there is a completed ZZ and the move down from 71.78
could be an X wave, but I have not zoomed out to consider the context to see how it could fit.
Holding 46.01 would be a key pivot to hold for these options to stay viable/considered.
The Bearish option is that a ZZ has completed and a new low is possible.
A completed ZZ does not necessarily mean the correction is complete as it could be the gateway to a
larger corrective structure.
If it breaks below 55$, by more than just a wick, and throws back for a retest that could lead to a LL as well.
But for now watching this area.
Already in the algo buy zone, but would be even more interesting if there is one more low to test the support
as well as there is ample other factors to contribute to the confluence, MO.
Algos
Previous Flip
Some Elliott Wave fibs as well.
Staying above 53.50 would be ideal.

AXS Long Hi Traders,
Hope you all are doing well,
Here is my AXSUSDT setup, which is showing an upside potential of 42% from the current market price.
This analysis is based on a fib retracement and Elliot wave.
At present we are testing 50% retracement from the previous lows and awaiting an impulsive wave 5.
CMP: 59.10
TP: 85 (42%)
SL: 50 (15%)
RR: 2.8
Happy Trading :)

AXSUSDT 4H: Possible LONGAXSUSDT 4H: Possible LONG
On the 4H chart, the price bounced back from the level of 56.00. This indicates a potential price increase to 76.00.

SLP can pump again ?KUCOIN:SLPUSDT
This is not financial advice 🙏🏼👌🏼
Do not forget financial management💸💰💷
Follow us for further analysis😎💞
Please write your comments for us 🤙🏼💬
Please share with your friend 👬👫😍😘
Be always profitable🤑🤩

AXSUSDT - SETUPAXSUSDT price after climbing up the trendline trying to retest it. If bulls keep their momentum they can fuel up the upside. Price dropped 120% from the Top and now trying to take back some gain. So buying on Dips will be a better strategy.

Can AXS surprise us again with pump ?As you can see we can see a GOLDEN CROSS on 4H timeframe .also we have dynamic support after breaking last downtrend . i opened the position at 63 USD . my target is 86 usd at 2.618 fibonaci . also do your researches and set your stop loss.

Axie Infinity (AXS) Buy ZoneAxie Infinity (AXS) Buy Zone
--------------------
BIAS
Mid-Term : Bullish
Risk : Medium
Axie Infinity broke above and retested our trendline, showing the market is short-term gaining bullish momentum and strength. If the retest gets successful, we would be heading to at least target 3 in short-term.
--------------------
$AXS/USDT LONG SETUP
Leverage : x3 - x5
Entry Price : 63 - 67
TP 1 : 69.25
TP 2 : 73
TP 3 : 77.75
TP 4 : 82
TP 5 : 87
TP 6 : 91.5
TP 7 : 97.5
TP 8 : 107
Stop Loss : 56.25
*Maximum 3% of Portfolio.
*Unload 12.5% at each TP. Whenever TP 2 hits, Move stop loss to entry.
--------------------
