AXS - Daily Chart ✅Let's see how AXS is behaving.
This is a 1H chart. (Valid for 24 hours)
The Fib retracement shows that the price has passed a resistance level, and now it's turned into support. Now it's retesting another resistance level.
The market is showing massive BUY volumes for AXS.
Two resistance levels push down on value, and one support level holds the price high and shows strength. The higher band can work as resistance.
The Upper Bollinger Band can push down the value, and the Middle band pushes the price up.
If the price crosses the local resistance and stays above it for confirmation, we can open our long positions, aim for the next resistance, and use it as a TP point.
The RSI shows that AXS is above the 50 levels, the center.
If you want to know how the RSI indicator works, take a look at this Educational Idea. It'll help you have better readings:
Current Market Price: $75.15
Let me know your ideas.
Good luck.
AXSUSDT

Add some AXS in the $ 50 to $ 64 rangeAXIE INFINITY By breaking its long-term positive trend line has entered further correction and has reached beautiful levels to buy. Add some AXS in the $ 50 to $ 64 range, which are good places to buy for holding. After price flooring, it will start its positive movement compared to other cryptocurrencies.
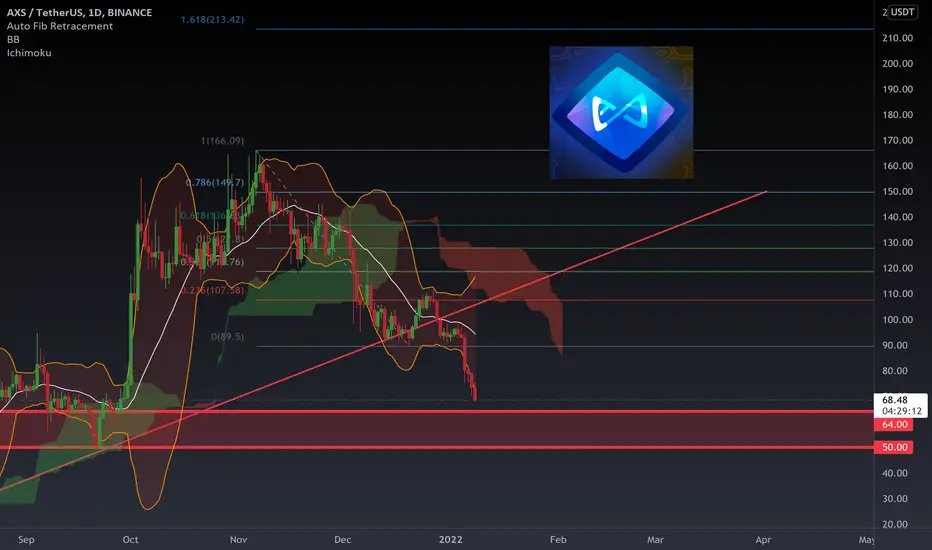
AXIE INFINITYOn a daily TF, the trend is negative. The $50 - $64 support range is suitable for buying. If the negative trend line and the $90 resistance are broken, the conditions for re-entry will be ready, and the $111 target will be activated.

AXS Long Term ChannelLong term parallel channel of chart is clear enough to show long strategy at the bottom of channel, but the point is that moving upward has not great chances in bearish market so any decision should be taken carefully.

AXSUSDT, The price is reaching to bottom of channelHello everybody
Surely you have heard about AXS (AXIE), is one the most popular game in blockchain and its working of NFT and Metaverse and this platform wanna ...
If you wanna learn fundamental & technical analysis you can send us messages in private ---> Our id is in profile
According to the chart, we expect the price should drop more to reach to the bottom of the channel and according to the price that at the beginning was started moved in upward channel at this time we expect the price that be supporting at this bottom and should move upwards but in this scenario that is ready to start new rally or its only move upwards for correction and emotional its very soon to say and predict. At first we take profit of this movement then the market move and show us other waves we can decide about this.
Dont forget if you be in position use stop loss and take trigger then entrance it.
If you have any question send us messages
Good Luck
Abtin
Previous analysis :

AXS - Daily Chart ✅Let's see how AXS is behaving.
This is a 1H chart. (Valid for 24 hours)
The Fib retracement shows that the price is sitting on the support after corrections.
The market is showing massive SELL volumes for AXS.
Two resistance levels push down on value, and one support level holds the price high and shows strength. The higher band can work as resistance.
The Middle Bollinger Band can push down the value, and the Lower band pushes the price up.
If the price crosses the local resistance and stays above it for confirmation, we can open our long positions, aim for the next resistance, and use it as a TP point.
The RSI shows that AXS is below the 50 levels, the center.
If you want to know how the RSI indicator works, take a look at this Educational Idea. It'll help you have better readings:
Current Market Price: $72.88
Let me know your ideas.
Good luck.

#AXSUSDT/ DAILY Important support levels are $ 57 / $48
Important resistance levels are $84 /$94 / $113
#axs # axsusdt #cryptocurrency #crypto #trade #technicalanalysis #trading

AXS Short time frame Posted a shorter time frame analysis else where but, so far the short term bullish played out pretty good. So from here thinking OMLU possible, not exiting all my longs, but from here will be watching for a possible retrace or lower low depending on the context of the move, if down from this area.
Flipped resistance into support
Hit some markers for an impulse up
Some grindage on the Pitchfork
Bounced from the .5-.615, got to target


AXS - Daily Chart ✅Let's see how AXS is behaving.
This is a 1H chart. (Valid for 24 hours)
The Fib retracement shows that the price is pumping and, we might experience rejections soon.
The market is showing SELL volumes for AXS.
Two resistance levels push down on value, and two support levels hold the price high and show strength. The higher band can work as resistance.
The Upper Bollinger Band can push down the value, and the Middle band pushes the price up.
If the price crosses the local resistance and stays above it for confirmation, we can open our long positions, aim for the next resistance, and use it as a TP point.
The RSI shows that AXS is below the 50 levels, the center. It's highly oversold.
If you want to know how the RSI indicator works, take a look at this Educational Idea. It'll help you have better readings:
Current Market Price: $80.78
Let me know your ideas.
Good luck.

Axsusdt cup and handle Retest done bullish AXSUSDT (4h Chart) Technical analysis
AXSUSDT (4h Chart) Currently trading at $80
Buy level: Above $81 (BUY AFTER BREAKOUT)
Stop loss: Below $71
TP1: $84
TP2: $89
TP3: $94
TP4: $100
Max Leverage 3x
Always keep Stop loss
Not A financial Adviceeeeeeeeeeeeeeeeeeeeeeeeeeeeee be carefull
Follow Our Tradingview Account for More Technical Analysis Updates, | Like, Share and Comment Your thoughts.

RNDR Contracting GPU Power Via Blockchain TechWish I would have bought some when Dave Lui dropped the alpha on it last year. RNDR is on the SOL blockchain. It appears as if SOL would be best suited for video games. Could we see popular NFT/ Metaverse coins transition from ERC-20 and go to the SOL blockchain? If so wouldn't a partnership with RNDR to offload some of the GPU workload be cool. Just a thought. Stick to TA. I'll be looking to start a position at outlined levels and take profit at 1.272.

AXSUSDT - Cup and Handle PatternAXSUSDT (4h Chart) Technical analysis
AXSUSDT (4h Chart) Currently trading at $78.9
Buy level: Above $79.6 (BUY AFTER BREAKOUT)
Stop loss: Below $71
TP1: $84
TP2: $89
TP3: $94
TP4: $100
Max Leverage 3x
Always keep Stop loss
Follow Our Tradingview Account for More Technical Analysis Updates, | Like, Share and Comment Your thoughts.

AXS retracing excess? One Elliott Wave count im keeping an eye on. TLDR: Want to see these previous resistance lines be breached and flipped into support before getting too excited for a bounce up. But have been short from the top so may be a bit biased. The Elliott Wave pattern just doesnt look complete. But I am fickle and can be swayed easily by the PA. And AXS can always do AXS things... like in the good ole days..

AXS/USDTHello''' According to previous analysis, we have reached the Elliott 4 wave and according to our expectations and analysis, it will be a good area to buy. If the downtrend continues, most of the uptrend channel floor is a good area to buy.This is not a financial recommendation


AXSAfter testing the 618% fib level and completing 5 up then bullish ABC correction AXS looks good to me, I think $200 is going to be hit for a larger wave 3 target.

AXS: Near-term Bull-Flag PT $246See my most previous Bull-Flag targets for SOL and LUNA... AXS with tons of market adoption and major investments from Samsung does provide an opportunity to be a gaming juggernaut in the gaming space. Axie bears some remarkable similarity to the virality of Pokemon about 25 years ago.... except with much higher sustainable uspide.
The Bull Flag Target is $246 and is a shorter-term expectation which I would expect to play out by Q1 2022 as major catalysts occur for AXS and greater adoption occurs.

AXIS ShortShorting AXIS here based on my engulfing candle strategy.
Stop is protective will update actions when taken.
EDIT - Price moved pretty quick got filled @ 71.519

AXS/USDTAXS/USDT LONG
ENTRY ZONE AREA
$ 71.8 - 71.3
SL : $ 68.18
TP1: $ 73.8
TP2: $ 75.7
TP3: $ 78.8
TP4: $ 82.5
TP5: $ 87.8
LEVERAGE 20x
(Use 3-5% of your capital balance)
@CCFIndonesianTrader

AXS will do a Break out soonHello every one
AXS /USDT
AXS is in a Falling wedge Pattern. the Break out needed for This Pattern has Not Happened yet. Sure The Break out can Happen Right now But There is another Scenario As well. we Can Expect a Pullback From The Support Range which is Drawn on The chart as well. The Expected Movement is to the Top of The Falling wedge pattern.
This is only an idea and not a financial advise ( NFA )🔴
💎Traders, if you liked this idea or have your opinion on it, write in the comments, We will be glad.
Thank you for seeing idea .
Have a nice day and Good luck

AXS on the way to $ 70With the growth of Bitcoin, AXS did not grow and even continued its downward trend
Bitcoin will continue to move with deep correction, and naturally AXS will reach the range of $ 70 in the first stage.

AXSUSDT POTENTIAL HUGE REVERSALAXS potential huge reversal after touching bullish trend line, note that divergence in MACD and RSI is in oversold area.
