Axs Most Probably Axs/Usdt
On the daily timeframe, AXS/USDT has confirmed a breakout, and the retest is almost complete. This retest is an important part of the breakout process, as it confirms that the previous resistance level has now become support.
Based on these patterns, we anticipate a potential 60-100% bullish move in the near future for AXS/USDT. However, it is essential to keep in mind that investing in the cryptocurrency market involves risk, and it is crucial to manage your risk and conduct your own research before making any investment decisions.
Therefore, we highly recommend conducting your own analysis and due diligence before investing in AXS/USDT or any other cryptocurrency.
If you find our analysis satisfactory, please consider following us for more updates on AXS/USDT and other cryptocurrencies. Thank you for reading, and happy trading!
AXSUSDTPERP

Axie Infinity (AXS) formed Gartley | A good buy opportunityHi dear friends, hope you are well and welcome to the new update on Axie Infinity ( AXS ) token US Dollar pair.
Or last trade setup of AXS was:
Now on a 4-hr time frame, AXS has formed a bullish Gartley pattern.

Axie Infinity token AXS price was pumping. Why and what next ?Yesterday there was an unpleasant situation on the AXSUSDT chart.
In 3 minutes, the price jumped from $7 to $19 on Binance. This pump was picked up by trading bots, and perhaps traders on other exchanges also managed to react. For example, on WhiteBit, the price rose to $14
The pump occurred because the purchases were made using API keys, at least 3 Binance users who traded using the API key on Skyrex a crypto trading bot platform.
Moreover, the trading balance of one of the users was in the region of $1 million.
CZ CEO Binance on Twitter reported that their team is clarifying the situation, and the user with the largest trading deposit confirmed and thanked him for the help.
Automation of trading is a convenient thing, many cryptocurrency exchanges implement a copy trading service for this, and it is clearly safer than trading through the API. At least because the responsibility for security lies with the cryptocurrency exchange with a large security department and appropriate tools, and when using an API key to trade on third-party platforms, the likelihood of hacking or compromise is much higher.
Here is the AXSUSD price chart on the 3-day time frame. As you can see, the AXS price has been in a falling channel for more than a year.
Yesterday's "manipulations" with the price of the Axie Infinity token formed the Japanese candlestick "Inverted hammer" , which in normal situations serves as a trend reversal signal. Whether this pattern can be taken into account in this situation is a controversial issue.
It can be assumed that perhaps in the future a reversal pattern "Head and Shoulders" will form. The global target for growth of this pattern is around $60.
We believe that the first safe purchases of AXS are possible if and when the AXSUSDT price can consolidate above $10.
The final reversal of the downtrend to the uptrend will come only after the price of AXSUSDT can gain a foothold above $19 (even during yesterday's artificial pump could not break this level)
_____________________
Did you like our analysis? Leave a comment, like, and follow to get more

#AXSUSDT Bearish channel breakTrade setup: Following a bearish break from Sideways Channel ($14-$20), below $14 support, price made a new Lower Low, which is a sign of Downtrend. It is now approaching $6 support. (set a price alert).
Trend: Downtrend across all time horizons (Short- Medium- and Long-Term).
Momentum is Mixed as MACD Line is above MACD Signal Line (Bullish) but RSI ~ 50 (Neutral).
OBV (On Balance Volume): is rising, indicating that volume on Up days is greater than volume on Down days. Hence, demand (buyers) exceeds supply (sellers).
Support and Resistance: Nearest Support Zone is $6. The nearest Resistance Zone is $14 (previous support), then $20.

AXSUSDT analysis buying signalMarket is on the way to our white buying area after formation of III white sequence

AXS/USDT - LONG --> Divergence ----- Welcome, dear followers! -----
- Here is my trading methodology. I trade with a normal system and analysis of resistance and support, as well as price reversal patterns.
- For the record, I do not place a stop loss within my trades. So that I only risk 1.5% of my total capital in order to support the loss due to a price reversal against me.
- If a price reversed against my expectation and touched the drawn line r3, then I transferred targets to the entry point and waited for the price to close at it with a loss equal to almost zero.
- Today's deal is shown in the chart, and here are the entry and exit points below.
-- Support me with numbers and follow up on my account for other deals in the future. Thank you for coming to this part.
---------------------------------------------------------
⚡️⚡️ AXS/USDT ⚡️⚡️
Exchange: Binance Futures
Trade Type: Breakout (Long)
Leverage: Cross (1.0X)
Entry Orders:
1) 9.75 - 100.0%
Take-Profit Orders:
1) 10.51 - 70.0%
2) 11.08 - 20.0%
3) 11.99 - 10.0%
Trailing Configuration:
Stop: Breakeven -
Trigger: Target (1)

AXS looks juicy for a pumpAXS looks juicy for a pump, we are sitting in good areas, if AXS flips get ready to long it!

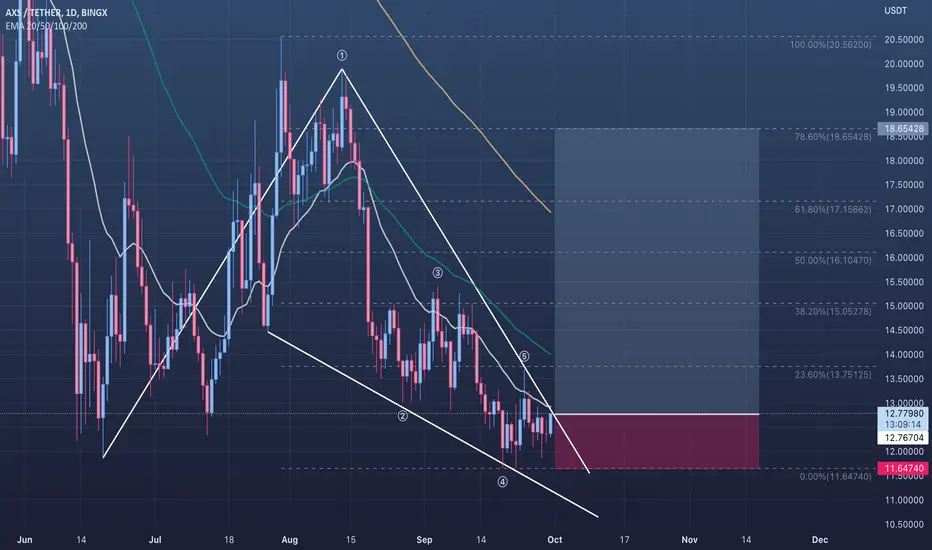
🟢 AXSUSDT - 1D (30.09.2022)🟢 AXSUSDT
TF: 1D
Side: Long
Pattern: Bull Flag / Falling Wedge
SL: $11.64740
TP 1: $13.75125
TP 2: $15.05278
TP 3: $16.10470
Nice bull flag / falling wedge on AXSUSDT.
Should be looking to break out soon.
Buy now and DCA or wait for price to reach the red area.
DAY 3: #AXSUSDT #LONGDAY 3: #AXSUSDT #LONG
2% of the deposit
Margin: isolated
⚖️Leverage: x10-20
🗝Entry point: 14.00-14.12
🎯target 1 - 14.39
🎯target 2 - 14.67
🎯target 3 - 15.08
🎯target 4 - 15.53
🎯target 5 - 16.09
❌stoploss: 13.50


AXSUSDTPERP (SHORT)AXS is currently on its last wave using the Elliot Double Combo Wave labeled as W, X, and Y. We are currently on the corrective phase of the completed 5-wave pattern of wave Y. This is also supported by 3 bearish harmonic patterns namely Gartley, Cypher, and Anti-Gartley. Based on my personal experience when several harmonic patterns will have the same potential reversal zone (PRZ) the more likely the pattern will play out.
DISCLAIMER: I do NOT offer financial advice. I am not a financial advisor. The content is for educational purposes only. YOU are responsible for your own investment decisions.

#AXS/USDT 2HOUR UPDATE BY CRYPTOSANDRS !!Hello, members welcome to AXS/USDT 2hr chart update by CRYPTOSANDERS.
I have tried my best to bring the best possible outcome in this chart.
As we can see from the above-mentioned chart the AXS/USDT brack the inverse head and shoulder pattern create and broke the neckline and retested the green zone and the current scenario we are expecting that get will go up all the way to $38.32 means almost 70%.
So if it moves to the green zone again then it will be the zone to go long on AXS/USDT
entry:-$21.10 , $22.30
target:-70%
stop-loss:-$19.60
with leverage 5x to 10x
Sorry for my English it is not my native language.
Remember:-This is not a piece of financial advice. All investment made by me is at my own risk and I am held responsible for my own profit and losses. So, do your own research before investing in this trade.
Do hit the like button if you like it and share your charts in the comments section.
Thank you.

Axs - What about a long?🧐⭐️ BTC had huge liquidations, we may see a pullback
⭐️ Market is panicking
⭐️ Structure is nice
⭐️ Stablecoins spooked a lot of people
⭐️ 5th touch
⭐️ No pullback after last touch
⭐️ Over VWAP
Will enter when price squeezes to the level on lower timeframes, the base will form and the strip will get faster.
Fix profit by parts:
2% - 1/3
4% - 1/3, stoploss to breakeven
What's left, hold to the maximum
What do you think of this idea? What is your opinion? Share it in the comments📄🖌
If you like the idea, please give it a like. This is the best "Thank you!" for the author 😊
P.S. Always do your own analysis before a trade. Put a stop loss. Fix profit in parts. Withdraw profits in fiat and reward yourself and your loved ones

Trading opportunity in AXSUSDTBased on technical factors there is a long position in :
📊 AXSUSDT Axie Infinity
🔵 Long Now 32.80
🧯 Stop loss 26.00
🏹 Target 1 37.00
🏹 Target 2 45.00
🏹 Target 3 61.00
💸Capital : 1%
We hope it is profitable for you ❤️
Please support our activity with your likes👍 and comments📝

AXS/USDT Risk/Reward=1/10 !!!???AXS/USDT is it to possible to expect risk/reward 1/10???
AS you can see on AXS chart it is clearly visible a broken descending channel and a nice pull back.The price is in the low of the channel.
Take a good profit!

AXSUSDT 1D: Possible LONGAXSUSDT 1D: Possible LONG
We can see a rebound from the price level - of 52 on the 1D chart. In the middle term, this signal indicates that the price may increase to 87.

AXSUSD Strong Support EncounteredAxie has broken out of a strong resistance within a down movement, simultaneously hitting a large support while doing so
This could be indicative of a reversal out of this small bear action we have seen
Daily Chart

AXS going for another all-time high?Weekly timeframe for AXS shows a hidden bullish divergence, would it go for another all-time high?
===================
Divergence is when the price of an asset is moving in the opposite direction of a technical indicator, such as an oscillator, or is moving contrary to other data. Divergence warns that the current price trend may be weakening, and in some cases may lead to the price changing direction.
Divergence signals tend to be more accurate on the longer time frames. You get fewer false signals. Divergences on shorter time frames will occur more frequently but are less reliable.
READ THIS NOTE!!
Market can do anything specially on crypto, because of Bitcoin, investors often consider Bitcoin as the reserve currency of the cryptocurrency market, similar to the USD in the global stock markets. When bitcoin (BTC), the largest cryptocurrency by market cap, goes up, other digital tokens tend to increase in value as well. When BTC declines, it's likely that other players in the space will drop at the same time.

Axie $AXS how long can the Ron bridge hold you? Axie AXS, Axie AXS how long can the Ron bridge hold you from falling
With 600m lost... How long can you stand tall.
Fall u must when bridge re-opens
Fall u shall when bridge flows
Let's c...
NAF DYOR

AXS LONG SETUP- Axie increased more than %40 last days and It broke the last swing high in 4 hourly chart.
- Now it is time to wait for the retracement. I split my money to 5 pieces for this position.
- So each arrow indicates one piece from my money.
- I will not close my long position untill Bitcoin reach $52000 level.
Kind Regards,
Fisherman..

buy AXS
Given the range of support can be a good opportunity to buy. In fact, the pullback is on the rise. Buy step by step with low lever. It is possible to modify bitcoins. Be sure to observe the loss limit.

AXSUSDT-LONGBased on technical factors there is a long position in :
📊 AXSUSDT Axie Infinity
🔵 Long Now 69.26
🧯 Stop loss 63.93
🏹 Target 1 78.48
🏹 Target 2 91.91
🏹 Target 3 111.11
💸Capital : 1%
We hope it is profitable for you ❤️
Please support our activity with your likes👍 and comments📝

Short AXSAXS showed an Adam & Eva bullish pattern, and will fill the FVG between 69 and 74. Then, a bearish Cypher Pattern will be completed and a significant pullback should be performed.
