GOLD SELLGold price bears retain control amid fading safe-haven demand, rebounding USD
US President Donald Trump announced late Tuesday that his administration had reached a trade deal with Japan. Furthermore, reports that the US and the European Union are heading towards a 15% trade deal boost investors' confidence and weigh on the safe-haven Gold price for the second straight day on Thursday.
The markets do not expect an interest rate cut from the US Federal Reserve in July despite Trump's continuous push for lower borrowing costs. In fact, Trump has been attacking Fed Chair Jerome Powell personally over his stance on holding rates and repeatedly calling for the central bank chief's resignation.
Moreover, Fed Governor Chris Waller and Trump appointee Vice Chair for Supervision Michelle Bowman have advocated a rate reduction as soon as the next policy meeting on July 30. This keeps the US Dollar depressed near a two-and-a-half-week low and could offer some support to the non-yielding yellow metal.
Traders now look forward to the release of flash PMIs, which would provide a fresh insight into the global economic health and influence the safe-haven commodity. Apart from this, the crucial European Central Bank policy decision might infuse some volatility in the markets and drive the XAU/USD pair.
Meanwhile, the US economic docket features Weekly Initial Jobless Claims and New Home Sales data, which, in turn, would drive the USD and contribute to producing short-term trading opportunities around the commodity. Nevertheless, the fundamental backdrop warrants caution for aggressive traders.
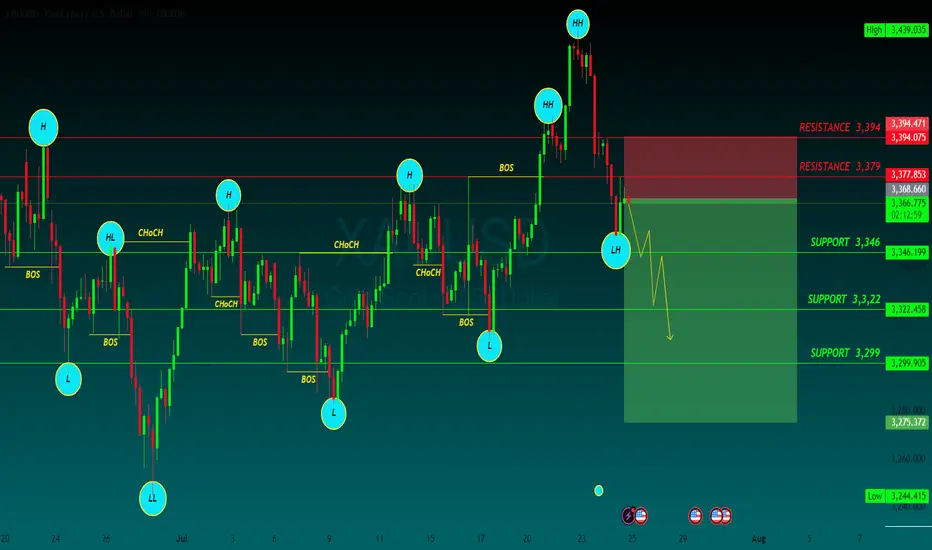
SUPPORT 3,346
SUPPORT 3,322
SUPPORT 3,399
RESISTANCE 3,394
RESISTANCE 3,379
Axuusd
Gold Surges, Hits Record Above $3,200Gold spiked to a new record above $3,200 per ounce on Friday, driven by safe-haven demand and a weakening dollar amid intensifying U.S.-China trade tensions. The U.S. hiked tariffs on China to 145%, while easing duties for other partners. At the same time, U.S. consumer prices unexpectedly fell in March, fueling bets on a Fed rate cut in June and a full percentage point cut by year-end. Despite this, inflation risks remain due to ongoing tariff pressure. Gold is set for its strongest weekly gain since November.
Key resistance is at $3,250, followed by $3,300 and $3,350. Support stands at $3165, then $3135 and $3090.


Pre-Market Analysis for Nasdaq, Oil, and Gold Futures The Nasdaq closed higher with an upper wick on the daily chart.
As mentioned previously, this week is expected to show buying pressure at the beginning, followed by selling pressure towards the latter half. After the 240-minute chart's buy signal, the daily chart's MACD is moving closer to the Signal line, indicating buying momentum. However, achieving a complete golden cross appears challenging due to the divergence and angle. The 21,900–22,000 range is considered a short-term high zone, where the market might either sharply drop after forming an upper wick or move sideways before failing the golden cross, leading to a downward shift in the MACD and a subsequent sell-off.
Notably, Nvidia, which has been driving the current index, continues to show strength. Monitoring Nvidia's previous high as a resistance point will be crucial. While the 240-minute chart exhibits strong buying pressure, the steep angle of the recent surge suggests that managing risk and opting for selling opportunities near the highs—rather than buying on dips—would be more advantageous. Additionally, keep an eye on key economic indicators such as the ISM Services Index and JOLTS report, which are scheduled for release today.
Crude oil closed lower with an upper wick.
Given its recent rapid surge, crude oil's daily chart shows significant divergence from the 5-day moving average. It is advantageous to focus on selling at the highs in this scenario. If the price pulls back to the 240-day moving average, observing whether it finds support will be critical. This week, oil could pull back to the 3-week moving average on the weekly chart and then rebound. Therefore, caution is advised against chasing the rally, and selling near previous highs would be prudent. However, buying on dips near the 3-week moving average could present an opportunity.
On the longer-term 240-minute chart, a bearish candlestick at the high has triggered a sell signal. It would be wise to anticipate potential sharp declines and prioritize selling during rebounds. For buying opportunities, it is recommended to act cautiously and at significantly lower levels.
Gold closed lower with a lower wick.
Ahead of Friday’s non-farm payroll data, gold is likely to remain range-bound in a consolidation phase. On the weekly chart, gold faces resistance from moving averages, and this week’s key data releases may determine its trend. On the daily chart, while a buy signal was generated, gold failed to make a significant surge, leading to the MACD and Signal line moving sideways.
With market flows becoming more uncertain, a range-bound strategy is advisable. On the 240-minute chart, gold could form a triangular consolidation pattern in the short term. Until Friday, trading within a range would be the most effective approach.
The weather has turned colder with a cold wave sweeping in, and flu season is here. Please take care of your health, and I wish you successful trading today!
■Nasdaq - Range-bound Market
-Buy Levels: 21,660 / 21,565 / 21,495 / 21,450
-Sell Levels: 21,885 / 21,940 / 22,005 / 22,045 / 22,110
■Oil - Bullish Market
-Buy Levels: 72.80 / 71.90 / 71.00
-Sell Levels: 73.60 / 74.20 / 74.85
■Gold - Range-bound Market
-Buy Levels: 2,641 / 2,635 / 2,625
-Sell Levels: 2,652 / 2,658 / 2,666 / 2,672

What's next for gold?
This is the 1-hour trend forecast for gold. Conclusions drawn from short-term trends.
Several factors affecting gold, interest rates. geopolitics. The dollar appreciates. war. Will make the trend of gold become confusing. So how to grasp a good trading opportunity. It is also necessary to know these news. A rate hike is imminent now. Boost the dollar. The U.S. dollar as the pricing unit of gold will directly affect gold. The decline should be a matter of time.
Risk aversion caused by war?
In fact, they are all talking again. The market is immune. So as long as it is not very intense, then the reference is of little significance.
Now it depends on the rate hike. This is an aspect that has a very large impact on gold in the short term. There will also be non-agricultural data released this Friday, which will undoubtedly have a huge impact on gold. The US dollar is an indirect indicator of the US economic situation.
If you don't know how to accurately control risks and trade safely, you can join me. Let's discuss communication together.

Who Said Trading Gold Isn't Profitable?
Follow the signal and remember to come to the base to contact me. I have always focused on real-time trading signals. Don't blindly follow trends.

Gold On the Daily Just making a note of the Gold Uptrend Channel! Seems, to be tracking nicely along this channel to the Upside.

buy gold now
The current trend of gold continues to be bullish. Mainly short-term buying. Institutional support funds entered the market last week. The support below is strong. So for now my personal suggestion. Mainly to buy.
follow me

AXUUSD bullish SenarioTrade Idea of GOLD Here we can Enter with confirmation in sell because Gold retrace back to Demand Area
then we can Expect another new high and again fill wick Area.

GOLD retracing in short side in LTF. But over Bullish Momentum.GOLD in Bullish Momentum in all high Time frame .
so,
Next move of bullish a possible move gold hit the target 23k.
a good buying areas of GOLD.
also,
In weekly Time frame market rejecting in the flip area.

AUDNZD LONG TRADE SETUP Acctually a Swing setup AUDNZD good Trade Setup
bcz
All High time frame showing long and in Daily Demand Area a nested demand area of H1 and This Zone Also Breaked a supply THIS Reason we can take trade and our SL is Last time Previous LOW .


Three strong ranges to trade: two buy ranges and one sell range1)Fluctuating purchase in the range of 1835.150 with a loss limit of 1823.556
2)Buying range with high win rate at the price of 1800.20 with a loss limit of 1784.098
3)Strong sell range at 1916.00 with stop loss at 1952.79

NAS100 SEEMS TO CONTINUE THE CURRENT BEARISH MOVE,8600 PipsNas100 had been on steady fall since 16th of August , however ,the current pull back seems to have come to an end and also happening at a major zone,
According to DANCOLNATION CAPITAL strategy, the next bearish touch at 10967 price level will be a confirmation of a possible drop of 8600+ PIPS with my 50% profit taken out at 100% retracement price level 10682 and the remainder at 10456
What a future reward for smart money SWING traders.

XAUUSD #1 ( one more time retest TH & higher Top !!! )Hello dear traders .
Good days .
The plotted route with weekly Gann Square & Gann Box is mapped to 2078 usd .
Safe trade & good luck .
Thanks for your comments and support .

BTC/USDT : 1W : TA : 2022-03-29In the weekly time frame, Bitcoin has almost reached the midline of the channel. It also has static resistance action and dynamic resistance of the resistance trend line. The probability of correction in this area is very high. Support and resistance areas have been identified.
I hope my analysis is useful, thank you for your support.
⏳update
👸raiN
📅Tuesday, March 29, 2022
🤷♀DYOR

XAUUSD @ Crispy Potato26/02/22
FORECAST FOR WEEK 1 MARCH 2022 = BEAR
COMBINED FORECAST FOR MARCH 2022 = BULL ( (with an initial bearish start)
DAYS OF FEB
WEEK 4 OF FEB FORECAST = BULL this was INACCURATE
PROBABILITY FOR NEXT WEEK = BEAR
This week was fair neutral until Thursday when a spinning top of indecision formed. Volume towered over all previous volumes, very nervous investors. Friday volume smaller still towers overall the previous days. Body of Friday did not enter the body of Thursday, only the top tail did. This indicates a move south is likely.
OBV is very bearish, questionable accuracy at this point.
WEEKS OF FEB
PREVIOUS WEEK 4 OF FEB ASSESSMENT = INACCURATE
PROBABILITY FOR NEXT WEEK = BEAR (Torn, one hand the cup handle has been broken, on the other, the pin bar with the large sell volume indicates a huge bear move pending.
Mon opened bear, within the current range, also Tuesday inside range but bull candle. Following on, Wed was a solid bull candle, nice size, little to no penetration back into Tuesday body. Thursday is similar to Wed but the volume is exceptionally large. Friday (reacted to the action of Russia Ukraine war) formed a shooting star. This tail protruded beyond the most recent high of the range, the body did not.
The OBV is out of wack with sharp moves, ignore
FORECAST MTH = BULL
Sizable bull candle, exceptional volume. OBV ow trends BULL. The chart looks to have commenced a BULL rally.
=============================
THE FORECAST FOR FEB = INACURATE
JANUARY FORECAST FOR FEB 2022 = BEAR

BTCusdt ⏰ Time Frame : DailyAs you can see, the price broke its uptrend and closed below the 50-day moving average (50MA)As The next bearish target will be in the range of 39000 $ to 40000 $ I think the price will move to down that I shown in chart, After that its important keep the support static
Follow our other analysis & Feel free to ask any questions you have, we are here to help.
⚠️ This Analysis will be updated ...
👤 Shahbaz Parsa : @shahbazparsa
📅 21.Feb.22
⚠️(DYOR)
❤️ If you apperciate my work , Please like and comment , It Keeps me motivated to do better ❤️

Upcoming gold trendsUpcoming gold trends
Gold is destined to break 1917, then we will see a drop to break 1676

SHIBUSDT 1D TA ; Support and ResistanceSHIBUSDT 1D Currently breaks the resistance range and if stabilized, there is a possibility of climbing to points on the chart. Otherwise, with the loss of this range, there is a drop to the support points.
Not buy or sell SIGNAL
@AtonicShark
DYOR

BNBUSDT_Daily_ 8.2.2022Hello dear friends, I hope you are well. We have a downward trend here that has hit the ceiling of the canal and we have a resistance level that has broken it. Break and climb to the level of 520, but there is a theory that it is possible to continue this process, I hope it is always profitable, please follow us

Gold Next movement Gold is stuck website 1830 to 1845 from 2 days. This rank is NO TRADE ZOME for me .
If its break 1845 it can move to 1867 resistance level, and if its break down 1830, then i'll take sell position to 1814.
