British Pound Futures
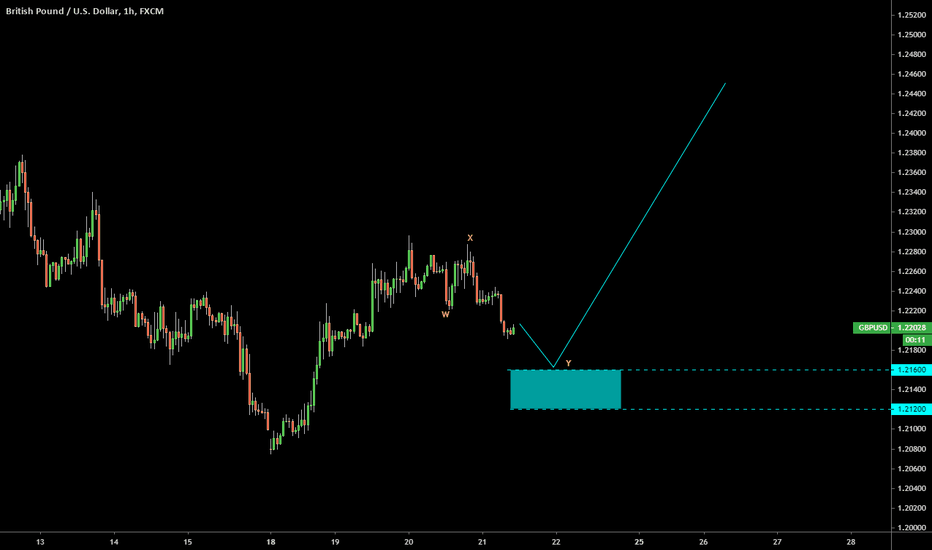
Potential rally in British Pound futures, valid for GBPUSDBuyers have passed important sellers zone near 1.2400 with significant volume. Range near 1.2400 is the nearest magnet now. Once retested and rejected we can consider longs with the final target near 1.26500. Note 1.23500 range has to hold to keep structure valid.
The Fed & BOEUS berencana mengurangi tariff produk dari china menjadi $100B (berita positif) sehingga berdampak pada keputusan the Fed yang berpotensi kuat untuk menahan suku bunga saat ini (market sudah price in).
BOE menghadapai ketidakpastian brexit dan sudah mendekati ke keputusan untuk dovish(normal).
Dari kedua kondisi tersebut, short GBPUSD lebih potensial.
British pound analysis Good evening guys,
Ive just released 2 ideas POUND-related and now i'll explain why im bearish on gbp so far, this is a GBP FUTURE chart for the current month.
First of all, on the left chart im not using traditional candlestincks, im using the Point N' Figure chart, its a great chart for those who wanna avoid the "noise" of the market, very good on stocks as well.
We can see on these chart gbp is breaking a structure support so far and the upwave volumes are too low showing there is not too much demand for gbp.
On the middle dailychart we can see the ascending trendline and gbp is just testing it now, a breakdown will confirm bearish behaviour for gbp.
On the left chart we can see that gbp is lacking demand so far with low volume up-candles.
This is just a reflection on what we can see on the other trading ideas, gbp is bearish now.
Now the most important thing is, gbp is BEARISH NOW, what about tomorrow? tomorrow we can have some news about brexit or anything else on eurozone that can shake the market, cant we? =)
Thats why stop losses and proper money management on trades are a MUST.
When and if i have some good audience i'll create some educational posts explaining about my trading style and philosophy.
Enjoy? leave a like =]
This is just an educational post and not a trading signal.
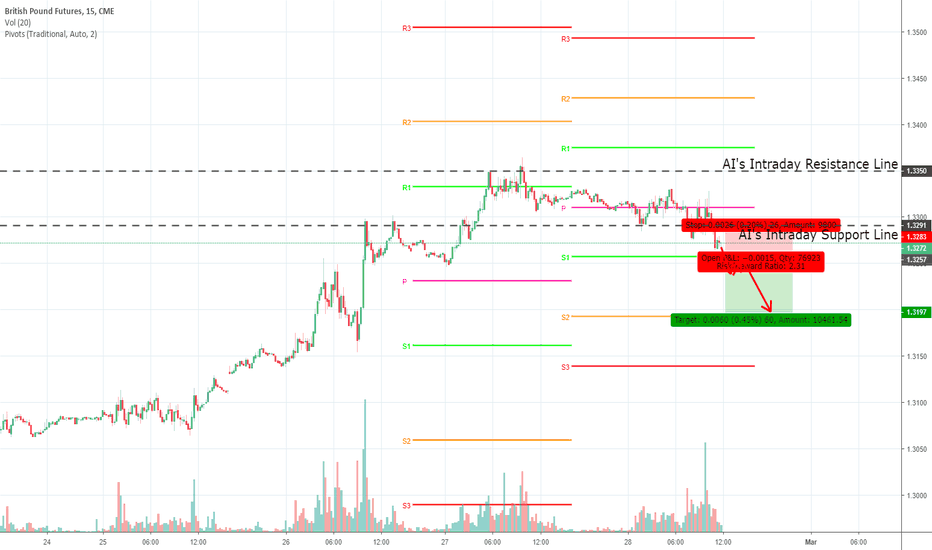
High Probability Intraday Trade Setup for British Pound FuturesThe following are trades setup ideas in 15 mins chart for British Pound Futures.
There are 2 distinctive dotted lines labeled as
1. AI's Intraday Resistance
2. AI's Intraday Support
These 2 Support and Resistance signal lines are generated by machine learning AI robots as a high probability trade setup for long or short.
If price action was below the AI Daily support line AND price closed below Pivot Point S1 line, the idea is to short and take profit at Pivot S2 price region.
Instead of relying on 100% discretionary (human) trading, the robots will provide trade execution plan and it is entirely up to the human trader's decision to follow.
This is highly recommended to trade during Europe and US market hours for liquidity and volume for this product.
GBPUSD Overbought Short Term - Initial expected weakness MondayRECAP: GBPUSD lower as expected but bottomed 19 pips above strong support at 1.3080/70. An unexpectedly strong bounce beat 1.3260/65 with stops above 1.3290 activated before a high 11 pips from 1.3325/35.
FORECAST: GBPUSD overbought short term so hopefully some initial weakness at the start of this week to allow us to start buying in to longs at 1.3235 & 1.3185, adding down to 1.3110/00. Holding above 1.3270/80 is positive targeting 1.3320/30. Above look for minor trend line resistance at 1.3379/80 then 1.3400
more of a challenge.
GBP/USD (GBP Futures CME) Buy 1.3115 (Target 1.3420)Signal:
Buy - 1.3115
Take Profit - 1.3420
Stop Loss - 1.3000
GBPUSD Bullish Gartley Near CompletionOverall I am looking for the dollar to drop this week and this bullish Gartley aligns with that idea. Entry is the blue line, stop loss is the red. Since I am looking for a larger move, I am hoping this small-risk entry can get me into a larger term trade. I will move stops to breakeven after a rise equivalent to my risk. Let's see...
British pound - Buy setupHere we see an impulsive move up to start the week, followed by a pullback to the 61.8 Fibonacci level. Watching to see if price respects the blue trendline and continues a move higher. Also watching the red zones which are previous resistance + Fibonacci extension areas for potential take profit targets.
British Pound hourly analysisHere we see price moving off of a larger time frame trend support line which is also a 78.6 Fibonacci retracement. If price breaks the green dash trend line, after a retest look to go long, if it fails to make a higher high and continues down, watch for a retest of the larger timeframe trendline or break for a longer term potential break down.


