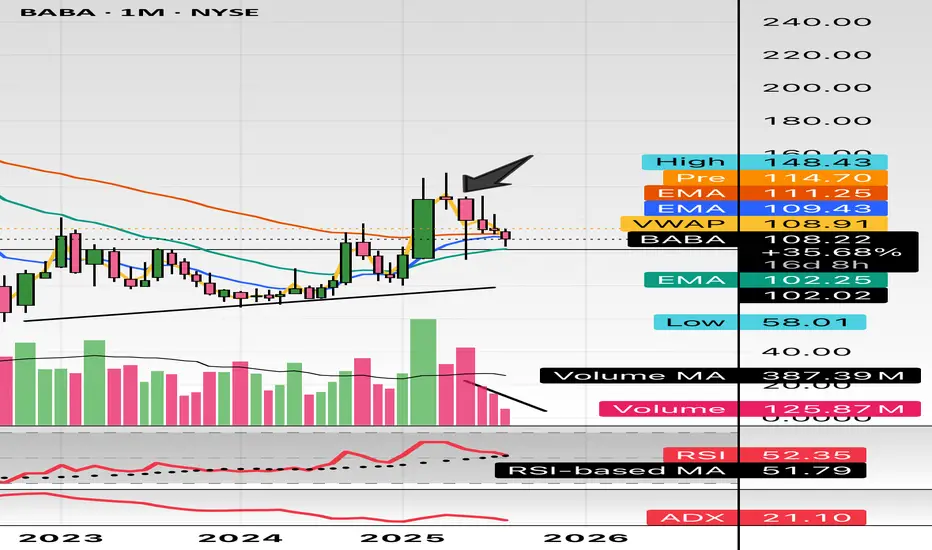
Long $BABA - NYSE:BABA is testing 200 SMA
- NYSE:BABA moves are explodes higher then cools then retest support then explodes higher than the last high. It's called trading with higher wavelength
-> Move 1: Started April 2024 when the trend reversal started. $68 -> $89 with around +30% then retraced $90 -> $72 ( -20% )
-> Move 2: July 2024, $72 -> $116 (+61%) then retraced $116 -> $80 ( -31% )
-> Move 3: Jan 2025, $80 -> $146 (+ 82.5%) then retraced $146 -> $108?? ( correction underway ) ~ -26% so far
-> Move 4: Likely from $100-105 to $180-200
BABA

Alibaba - A remarkable reversal!🛒Alibaba ( NYSE:BABA ) reversed exactly here:
🔎Analysis summary:
Recently Alibaba has perfectly been respecting market structure. With the current bullish break and retest playing out, there is a very high chance that Alibaba will rally at least another +20%. But all of this chart behaviour just looks like we will witness a major bottom formation soon.
📝Levels to watch:
$110, $135
🙏🏻#LONGTERMVISION
Philip - Swing Trader

BABA: triangle with tensionOn the weekly chart, BABA has already formed a golden cross - price is above both MA50 and MA200, confirming a bullish trend shift. The stock is now approaching the upper edge of the symmetrical triangle and the key resistance at $122, which also aligns with the 0.5 Fibonacci level.
The numbers inside the triangle represent the contraction phases, not Elliott waves. This is a classical consolidation before a potential breakout. If the $122 level is broken and retested, upside targets are $128 (0.618), $137 (0.786), and eventually $148–181 (1.0–1.618 extension).
Volume is rising, MACD is flipping bullish, and RSI is climbing out of oversold territory — all signs point to growing bullish momentum.
Fundamentally, Alibaba benefits from China's economic rebound, possible regulatory relief, and ongoing share buybacks. With Chinese tech rotating back into favor, BABA could lead the rally.
So if you're still waiting for a signal - it's already here. The golden cross is done, price is flying above moving averages, and all that’s left is a clean breakout. Watch $122 — that’s the launchpad.

$BABA don’t miss this milky bottle. Called this out at $105 in minds. This Monthly declining volume, support at $100, and uptrend pattern. China will boom into the end of Q3 and early 2026. Target is $180 and $200.
WSL.
$BABA 160+ before year end looks realistic thanks $NVDA- NASDAQ:NVDA export ban lifted for China will be beneficial for NASDAQ:NVDA for sure but main advantages would be for NYSE:BABA as they can get the shovels from the shop as well so that they can compete in Gold Rush and compete with NASDAQ:GOOGL , NASDAQ:META and other private companies like Open AI and Anthropic.
- There are good universities in China and NYSE:BABA is regional big tech in China which gets great talent. I'm confident that NYSE:BABA would be able to compete with NASDAQ:META & NASDAQ:GOOGL in building LLMs even better with this export ban lift.
- Long NYSE:BABA and short/avoid NASDAQ:META ( overvalued )
Alibaba | BABA | Long at $108.84Like Amazon, I suspect AI and robotics will enhance Alibaba's NYSE:BABA e-commerce, logistics, and cloud computing operations. There is some risk here, like other Chinese stocks, that they could be delisted from the US market if trade/war tensions rise. But I just don't think that is likely (no matter the threats) due to the importance of worldwide trade and investment. I could be way wrong, though...
NYSE:BABA has a current P/E of 14.2x and a forward P/E of 2x, which indicates strong earnings growth ahead. The company is very healthy, with a debt-to-equity of 0.2x, Altmans Z Score of 3.3, and a Quick Ratio of 1.5. If this were a US stock, investors would have piled in long ago at the current price.
From a technical analysis perspective, the historical simple moving average (SMA) band has started to reverse trend (now upward), indicating a high potential for continued (overall) price movement up. It is possible, however, that the price may reenter the SMA band in the near-term - the $80s aren't out of the question - as tariff threats arise. But that area is another personal entry zone if fundamentals hold.
Thus, while it could be a bumpy ride and the risk is there for delisting, NYSE:BABA is in a personal buy zone at $108.84 (with known risk of drop to the $80s in the near-term).
Targets into 2028:
$125.00 (+14.8%)
$160.00 (+47.0%)

Alibaba (BABA) Shares Fall to Lowest Level in 2.5 MonthsAlibaba (BABA) Shares Fall to Lowest Level in 2.5 Months
Yesterday, Alibaba (BABA) shares dropped to their lowest level since late April. The decline followed the company’s announcement of a planned bond issuance totalling approximately $1.53 billion, with a maturity date set for 2032. The funds will be used to support the development of Alibaba's cloud infrastructure and expansion of its international e-commerce business.
The market’s negative reaction may stem from concerns over rising debt levels and the potential return on these investments.
Technical Analysis of Alibaba (BABA) Share Price
When analysing the price movements of BABA shares in 2025, two key trading ranges stand out:
→ $126–145: This range originates from the long bullish candle on 20 February, following the release of a strong quarterly report;
→ $96–103: This zone was established in late April, as supply and demand stabilised around the psychologically significant $100 level.
The upper range has since acted as a resistance zone, with the price reversing from it in mid-May. The lower range has served as a support area, particularly in early April when the stock came under pressure after tariff-related headlines.
The current price action is notable in that Alibaba shares have:
→ Broken through the June support level at approximately $111.92;
→ Formed a bearish A-B-C structure, marked by lower highs and lower lows.
Using Fibonacci extension analysis, we can reasonably assume:
→ The $111.92 level is now likely to act as resistance;
→ The next potential target for the ongoing downtrend (leg C→D) lies at the 1 Fibonacci level ($100.55) — aligning closely with the previously identified support zone.
This article represents the opinion of the Companies operating under the FXOpen brand only. It is not to be construed as an offer, solicitation, or recommendation with respect to products and services provided by the Companies operating under the FXOpen brand, nor is it to be considered financial advice.

Why BABA Alibaba Could Rebound Strongly by Year-End 2025If you haven`t bought BABA before the recent rally:
What you need to know:
BABA’s fundamentals, fueled by e-commerce, cloud, and AI, support its technical bullishness:
E-commerce and Cloud Rebound:
Q1 2025 revenue grew 7% year-over-year, with Taobao/Tmall rebounding and cloud revenue surging due to AI demand.
Alibaba’s cloud division, China’s largest, benefits from hyperscaler AI workloads, with 15% profit margin projections by 2029.
AI Leadership:
BABA’s AI assistant and generative AI tools drove a 70% stock surge in early 2025, positioning it as a leader in China’s AI race.
At 12x forward P/E with 8% revenue CAGR, BABA is undervalued (fair value ~$162).
Share Buybacks:
Aggressive share repurchasing (6% annual reduction) boosts EPS, with $1 trillion GMV reinforcing e-commerce dominance.
Macro Tailwinds:
Easing CCP regulations and China’s stimulus measures (e.g., rate cuts) support BABA’s rally.
Minimal U.S. exposure insulates BABA from trade war risks.
Conclusion: BABA’s Path to $168
BABA’s technicals, with a bullish breaker and wedge, signal a breakout above $125–$130, targeting $150–$168 by year-end 2025. Fundamentally, its e-commerce dominance, cloud/AI growth, and undervaluation make it a standout. Traders should buy dips near $110–$115 or await a $130 breakout. With stimulus and buybacks as catalysts, BABA is set to soar.
Disclosure: I am part of Trade Nation's Influencer program and receive a monthly fee for using their TradingView charts in my analysis.

BABA Stock: A Detailed Analysis using Elliott Wave Theory RulesHello Friends,
Welcome to RK_Chaarts,
Let's analyze Ali Baba Group Holdings Limited, also known as BABA, listed on the NYSE. We'll be using the Elliott Waves theory.
Friends, as we can clearly see, after hitting a low of around $95.75 on 9th April 2025, it started an impulse wave. Within this wave, we've completed intermediate degree blue bracketed (1), (2), (3), (4), (5), and primary degree ((1)) in Black. Currently, we're completing primary degree ((2)), with a low around $111.
If it breaks the level of $111, we'll assume we're still in primary degree ((2)), as marked in scenario 2 on the chart. This means wave ((2)) is unfolding, and wave ((3)) might start after wave ((2)) is complete.
If it doesn't break the $111 level, it's likely that wave ((2)) has completed, and we've started a subdivision of wave ((3)) or its further subdivisions. If it moves further up, following scenario 1 (the black line on the chart), this is a possibility.
According to Elliott Wave theory, wave ((2)) cannot retrace more than 100% of wave ((1)). So, our main invalidation level for this count is $95.75. Yes, BABA is turning up against the 95.75 low, and in the near term, we expect the stock to trade higher.
Somewhere, this stock might move towards $150 or $160 if it doesn't break down below $ 95.75.
I am not Sebi registered analyst.
My studies are for educational purpose only.
Please Consult your financial advisor before trading or investing.
I am not responsible for any kinds of your profits and your losses.
Most investors treat trading as a hobby because they have a full-time job doing something else.
However, If you treat trading like a business, it will pay you like a business.
If you treat like a hobby, hobbies don't pay, they cost you...!
Hope this post is helpful to community
Thanks
RK💕
Disclaimer and Risk Warning.
The analysis and discussion provided on in.tradingview.com is intended for educational purposes only and should not be relied upon for trading decisions. RK_Chaarts is not an investment adviser and the information provided here should not be taken as professional investment advice. Before buying or selling any investments, securities, or precious metals, it is recommended that you conduct your own due diligence. RK_Chaarts does not share in your profits and will not take responsibility for any losses you may incur. So Please Consult your financial advisor before trading or investing.

BABA Weekly Options Play – 2025-06-10🧾 BABA Weekly Options Play – 2025-06-10
Bias: Moderately Bearish
Timeframe: 5 trading days
Catalysts: Weakening momentum, max pain gravity, fading upside catalysts
Trade Type: Single-leg PUT option
🧠 Model Summary Table
Model Direction Strike Entry Price Target Stop Loss Confidence
Grok Bullish 125.00C $0.77 $1.16 $0.385 65%
Claude Bearish 117.00P $1.75 $2.63 $1.23 65%
Llama Bearish 119.00P $2.85 $3.42 $2.28 65%
Gemini Bullish 125.00C $0.77 $1.35 $0.38 68%
DeepSeek Bearish 114.00P $0.79 $1.19 $0.55 70%
✅ Consensus: Moderately Bearish
📉 Core Setup: Downside pullback toward $115–118 support zone
⚠️ Outlier: Gemini and Grok see potential call upside on sentiment rebound
🔍 Technical & Sentiment Recap
Trend: Mixed structure—price stuck between declining intraday EMAs and longer-term resistances
Momentum: Bearish MACD and RSI signals across M5 & daily on 3/5 models
Sentiment: VIX 16.8 (neutral), Max Pain at $118 = gravitational anchor
Options Flow: Heavy call OI near $124–125 (potential cap); Put flows dominate below $118
✅ Final Trade Recommendation
Parameter Value
Instrument BABA
Strategy Single-leg PUT (weekly)
Strike $115.00
Entry Price $1.13 (ask)
Profit Target $1.70 (~50% gain)
Stop-Loss $0.79 (~30% loss)
Size 1 contract
Entry Timing At market open
Confidence 65%
🎯 Rationale: Favorable risk-reward in short-dated put to capture downside drift toward $115 zone. Models align around a modest pullback, driven by technical weakness and lack of fresh bullish catalysts.
⚠️ Risk Factors
Sharp bounce from short-term oversold RSI
Sudden news catalyst (AI/cloud deal, macro relief) could fuel call side squeeze
Weekly options decay accelerates sharply by Thursday
Max pain shift or volatility compression could mute movement
📊 TRADE DETAILS SNAPSHOT
🎯 Instrument: BABA
🔀 Direction: PUT (SHORT)
🎯 Strike: 115.00
💵 Entry Price: 1.13
🎯 Profit Target: 1.70
🛑 Stop Loss: 0.79
📅 Expiry: 2025-06-13
📏 Size: 1 contract
📈 Confidence: 65%
⏰ Entry Timing: open
🕒 Signal Time: 2025-06-08 23:55:22 EDT

Alibaba: Intermediate Correction in ProgressAs Alibaba has remained below resistance at $121.28, we’ve ultimately chosen to consider the high of orange wave x as established. Thus, we currently place the stock in bearish wave y, which should conclude the corrective structure of the larger blue wave (ii). From that point, BABA should reverse, climb back above the $121.28 resistance, and move to significantly higher levels—initially completing blue wave (iii), and eventually the larger turquoise wave 3. However, there’s still a 34% chance that our bearish alternate scenario will play out. In that case, the stock would fall between the two support levels at $80.05 and $58.01, where the low of turquoise wave alt.2 would form.
📈 Over 190 precise analyses, clear entry points, and defined Target Zones - that's what we do.

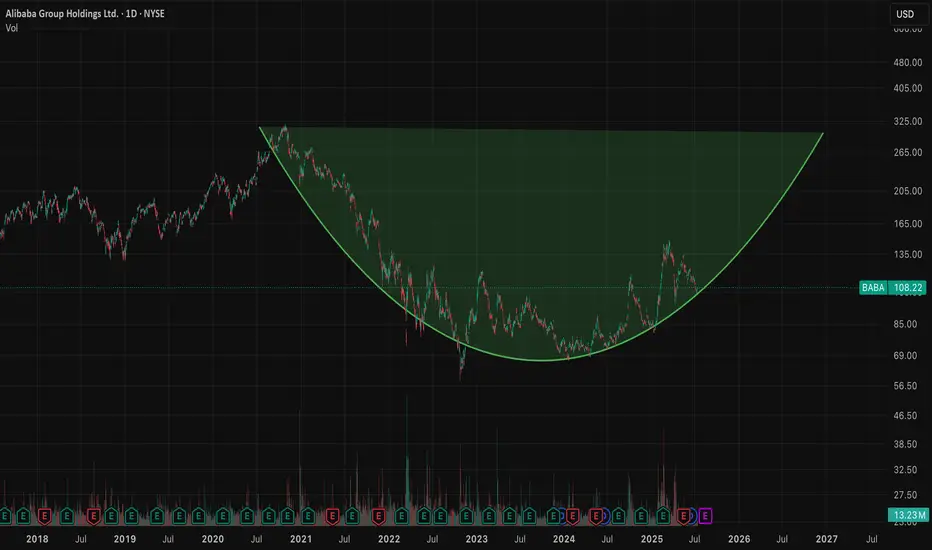
Alibaba - This was just the obvious bottom!Alibaba - NYSE:BABA - will head much higher:
(click chart above to see the in depth analysis👆🏻)
Ever since Alibaba actually retested the previous all time low in 2022, we have been able to see the textbook creation of a rounding bottom formation. Even the recent break and retest was perfectly playing out and if Alibaba confirmes the potental breakout, a rally of +50% will most likely follow.
Levels to watch: $140, $220
Keep your long term vision!
Philip (BasicTrading)

Alibaba - This Chart Speaks In Money!Alibaba ( NYSE:BABA ) prepares for a significant pump:
Click chart above to see the detailed analysis👆🏻
Basically since Alibaba was listed on the NYSE, it always perfectly respected market structure. With the recent rejection away from the key neckline, Alibaba is now creating a bullish break and retest. After bullish confirmation, this forms a bottom and we might see new all time highs.
Levels to watch: $110, $140
Keep your long term vision,
Philip (BasicTrading)

Alibaba - Don't Forget Chinese Stocks Now!Alibaba ( NYSE:BABA ) still remains super interesting:
Click chart above to see the detailed analysis👆🏻
After we saw the very expected parabolic rally on Alibaba about four months ago, Alibaba is now perfectly retesting major previous structure. Yes, we could see a short term pullback in the near future but this just offers a perfect break and retest after the rounding bottom pattern.
Levels to watch: $110, $140
Keep your long term vision,
Philip (BasicTrading)

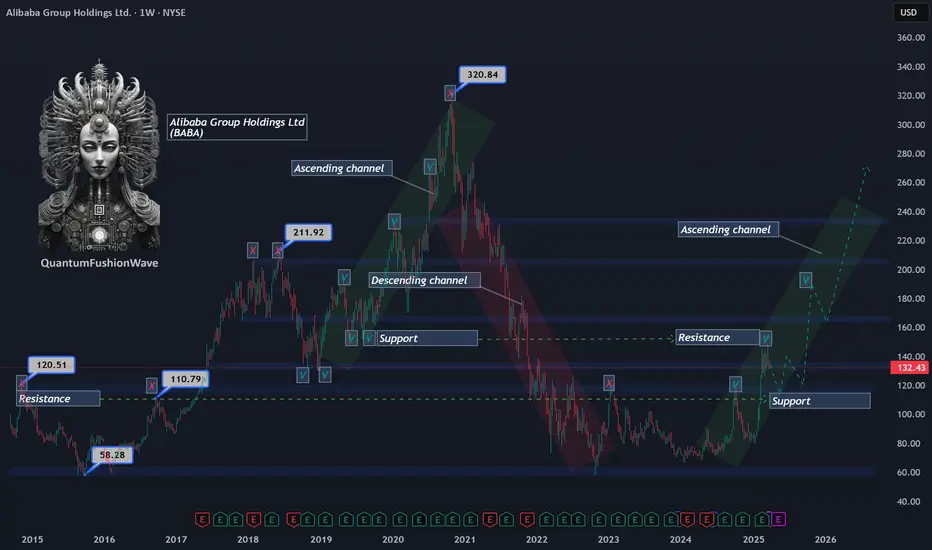
Alibaba (BABA) Technical Analysis:Retracement Within an Ascending Channel
Alibaba (BABA) has faced strong supply pressure at $149, a key price level that previously acted as support in 2019 and has now flipped into resistance. The inability to reclaim this level has triggered a retracement, with the stock currently trading around $132, showing signs of continued corrective movement.
Despite the short-term weakness, BABA remains within a developing ascending channel, suggesting a potential higher timeframe bullish structure. If the retracement extends, the next significant level to watch is $110, a historical 2016 resistance level that could now act as a demand zone. A strong reaction and rejection from this level would reinforce the validity of the ascending channel and increase the probability of a trend continuation toward previous all-time highs.
Key Levels to Watch:
Resistance: $149 (2019 support turned resistance)
Current Price: $132 (active retracement zone)
Support Levels:
$110 – Historical resistance from 2016, potential demand zone
$100 – Psychological level, further downside risk
Traders should monitor price action around these key levels, as a confirmed breakdown below $110 could invalidate the channel and shift market structure to a more bearish outlook, while a strong bounce could provide a high-probability long setup within the channel’s framework.
Beginning of the Uptrend for Stock #01Beginning of the Uptrend for Stock #01: 9988 (BABA)
The price has broken out of a consolidation range that lasted approximately two years, supported by a normal volume distribution.
The stock has risen to meet the Fibonacci Extension resistance level of 161.8 at a price of 144 HKD. Currently, it is forming a sideways consolidation pattern on the smaller timeframe, establishing a base structure viewed as re-accumulation.
The 6-month target is set at the Fibonacci Extension level of 261.8, which corresponds to a price of 189 HKD. This target aligns with a price cluster based on the valuation from sensitivity analysis, using the forward EPS estimates for 2025-2026 as a key variable for calculations, along with the standard deviation of the price-to-earnings ratio.
Wait for the Right Moment to Accumulate Shares within the Consolidation Range
Purchase near the support level of the range when the price pulls back. Look for a candlestick reversal pattern as a signal to add to your position.
However, should the price break down to the lower consolidation range, the stock would lose its upward momentum, potentially leading to a prolonged period of consolidation or a deeper pullback to around 90 HKD.
Always have a plan and prioritize risk management.

$BABA HARMONICS Suggest move is over with a possible $95 TargetNot sure if I'm doing this correctly but please do chime in and help out if you can. What this is, is an addition to my previous post about BABA coming back down to EARTH. I'm just adding another chart to reinforce the idea.

$BABA on its way to $120s into AprilI would honestly be surprised if it doesnt gap down this Monday before the open. The weekly imo, looks like a mess atm and could gap into $120s easy. If it doesn't, I would expect some consolidation for a fall into the First week of April. We're right at the golden pocket retrace at the .618, very common retracement level, if we look at Fibs with a bearish perspective and measure a retrace back to the lower golden pocket at 1.61 fib from highs, $112.30 would be my ultimate target if we can break $126. $126 opens the flood gates to our ultimate target at $112.

H5 Trade of the Week! 21% UpsideNASDAQ:BIDU Swing Trade is Primed!
In this video, I'll give you:
- Full Trade Idea
- Entry & S/L
- Options Taken
- Profit Targets
Check it out!
Not financial advice

Alibaba (BABA) Share Price Declines from 40-Month HighAlibaba (BABA) Share Price Declines from 40-Month High
As shown in the Alibaba (BABA) share chart, the price reached a 40-month high this week, surpassing $145 per share.
Bullish sentiment is being fuelled by news related to AI prospects in China. According to media reports:
→ China’s AI spending is increasing through investments from state-owned enterprises, private companies, and local authorities, aiming to keep pace with the US $500 billion Star Gate project.
→ Alibaba plans to invest $52 billion over three years in artificial intelligence and cloud computing.
Technical Analysis of Alibaba (BABA) Shares
Despite a positive fundamental backdrop, the chart signals potential concerns:
→ The price is near the upper boundary of the ascending channel, which could act as resistance.
→ Bulls attempted to break the $145 level (which has acted as resistance since late February) on 17 March but failed, as the price could not hold above this mark.
→ Using your preferred oscillator, you are likely to observe a bearish divergence between peaks A and B.
This suggests that bullish momentum may be weakening, and investors could consider taking profits after Alibaba’s exceptionally strong price rally—up approximately 70% since early 2025. If so, a break below the orange trendline could lead to a correction towards the median of the blue channel.
This article represents the opinion of the Companies operating under the FXOpen brand only. It is not to be construed as an offer, solicitation, or recommendation with respect to products and services provided by the Companies operating under the FXOpen brand, nor is it to be considered financial advice.

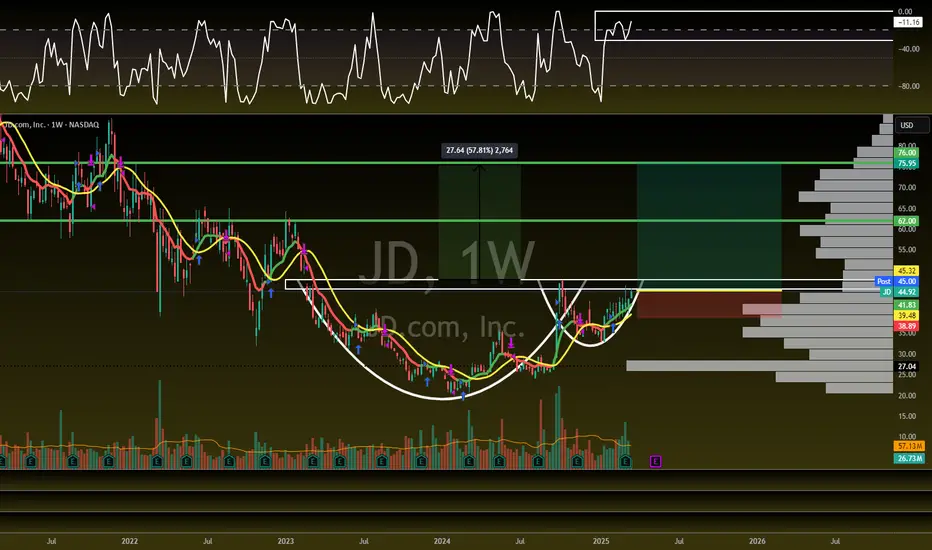
China Trade Setup with 67% Upside!NASDAQ:JD - H5_W Trade Setup: 🚨
CupnHandle Breakout =
🎯$62
📏MM: $76
- Multi Year CupnHandle
- Green H5_W
- Volume Shelf with GAP
- Thriving WCB
- China is HOT!
Not financial advice
A NEW China Name just getting Started! 80% UpsideNASDAQ:BIDU - H5_W Trade Setup: 🚨
Breakout = 🎯$155 - 50% Higher 🚀
- Double Bottom
- WCB Forming
- H5_W is Green
- Volume Shelf
- China is Bullish
Not financial advice

Bullish Play on (BABA) Ahead of Chinese Economic Data & Alibaba (BABA) is forming a triple top pattern near the $142-$145 resistance zone ahead of key economic data releases and potential positive stimulus measures from the Chinese Congress meeting. While a triple top is traditionally seen as a bearish formation, a breakout above resistance could signal strong bullish momentum, fueled by market optimism regarding Chinese economic support and potential tariff relief.
Trade Setup: Long Position on BABA
📈 Entry Point:
Breakout confirmation above $145 (previous resistance).
If momentum is strong, consider scaling in at $143-$144 for an early entry.
🎯 Target Price:
First Target: $155 (short-term resistance from early 2023).
Second Target: $165 (next major psychological level if sentiment remains strong).
🛑 Stop-Loss:
Below $138 (recent swing low and key support zone).
Alternatively, a trailing stop-loss to secure profits as the price rises.
Catalysts Supporting a Bullish Breakout:
1️⃣ China’s Economic Stimulus 🏦
The Chinese government is expected to announce new stimulus measures to support growth, which could boost investor confidence in Alibaba and other Chinese tech stocks.
Potential fiscal easing & liquidity injections may drive funds into large-cap Chinese equities.
2️⃣ Positive Economic Data Expectations 📊
Retail Sales & Industrial Production (March 17, 2025)
Strong numbers would indicate a rebound in consumer spending & manufacturing, benefiting Alibaba’s core e-commerce business.
3️⃣ Tariff Reduction Speculations 🌎
If the Chinese Congress signals progress on easing U.S.-China tariffs, Alibaba could see increased foreign investment & improved profitability.
4️⃣ Technical Breakout Potential 🔍
The triple-top pattern could turn into a breakout if volume surges past resistance ($145).
A move above this level could trigger short-covering & FOMO buying, leading to a quick rally.
What If the Data Disappoints?
If economic data underwhelms, BABA could reject resistance and pull back toward $130-$135.
In this case, waiting for a confirmed breakout before entering long positions is advisable.
📌 Final Thought:
BABA is at a critical inflection point. If economic optimism and stimulus expectations materialize, a breakout past $145 could fuel a strong rally toward $155-$165. Traders should watch for volume confirmation and be prepared to ride the upside while managing risk carefully. 🚀💹
Check out my other ideas about chineese stocks and more:
