JD - ARC ENDING - UP OR DOWN?All,
JD looks like it's going to make a pretty sizeable move here. My honest guess is the downside. With that said I don't think they are a bad company by any means. Decent earnings etc. I just don't see the traffic/high level interest to really keep the momentum up. That being said I always plot both theories up and down so of course do your own DD. Like most of these plays I would do 1:1 puts/calls and drop the other when you have conformation.
BABA

should be correctedA strong downward movement should be corrected sooner or later. The rise may close the gap. be careful
BABA's first attempts to break out of resistance !!!101 Technical analysis trend line + channels.
1/ 2ed attempts for a historical low bullish break out, the first got rejected
2/ 1st attempts for a previous/recent high for a bullish break out = In progress.

BABA. We could have already finished wave Z of WXYXXZ ="Earning"On Friday 29th, if we have solid earnings we could have a big bullish move. The only move that i am not buying is the
last one on daily it's kind of ABC corrective "Against the trend " move. On smaller time frames you might count it
as impulsive but on larger it's more ABC.

UPST - BE READY - SET ALERTS All,
UPST with last ER is just a must watch down here it could hold here, or drop down but I for sure think we have a MASSIVE bounce if it drops down on that trend line.
This is all pending the market. SPY falling knives can slice any mid/large cap.

✅ALIBABA LOCAL LONG/PORTFOLIO ADDITION🚀
✅ALIBABA is trading in a downtrend
Following the company's falling out of favor
With the Chinese Government
And fueled further by the Coming Evergrande collapse
That will drag China down with it
Today, the stock gapped and fell even lower
On the earnings news
However, a massive support level is ahead
At around 128$ per share, and I think
This might be a great local long
With the upside limited by the falling resistance
Also, with the stock trading with 60% discount
It might be a good place to start adding BABA to your long term portfolio
As it is clear that whatever economic storm is coming
Alibaba will be the one candidate to survive it
LONG🚀
✅Like and subscribe to never miss a new idea!✅

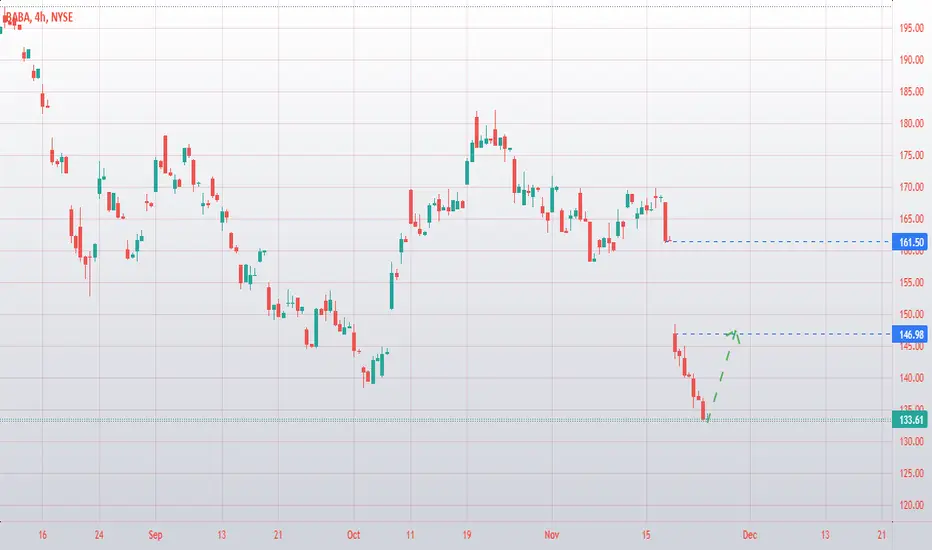
BABA - Next week projectionIt seems than next week the chart will be bouncing between 140 and 150.
Then most likely it will bounce from the 150$ resistance again towards 140$ - from here it things may start changing,

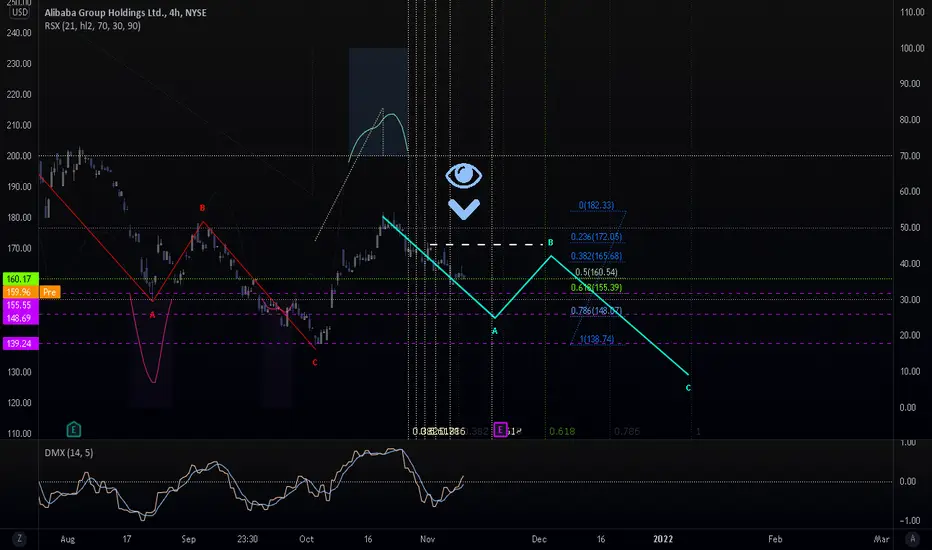
AliBABA dropping in momentum. BABAWe are likely to lose even more ground on this one. It's quite a classical picture: zigzag, upgoing zigzag to resume in more zigzag. I am oversimplifying things ofcourse here. Taking conservative goals here, as we have dropped a significant amount on his one and have been doing so for a significant amount of time also. We do not know why, but continue to observe that any market follows rules of fractal action with a series of cohesive collapsing and expanding, repeating patterns. We use this principle in market analysis and this is by far the most effective approach that we know of.
We are not in the business of getting every prediction right, no one ever does and that is not the aim of the game. The Fibonacci targets are highlighted in purple with invalidation in red. Fibonacci goals, it is prudent to suggest, are nothing more than mere fractally evident and therefore statistically likely levels that the market will go to. Having said that, the market will always do what it wants and always has a mind of its own. Therefore, none of this is financial advice, so do your own research and rely only on your own analysis. Trading is a true one man sport. Good luck out there and stay safe!
LONG BABA:TRADE OF THE CENTURYLong baba 1@140 & double down limits at 2x130, 4x88 and 8x58.
Possible to hedge with LONG $55 baba put LEAP hedging 5-10% of ur stonk notional.
Also possible to participate in the downside between 140-130 and 130-90 and 90 to 60. these key bear 'breakout' levels smart buyers may want to structure option exposure around and between to take alpha out on the downside.
this is trade of the century - trade time is 12-36m with target of 300-500 depending on ur duration preference.
why? baba is at MACRO supp level at 130-140. bears will NOT take this lvl.
institutional flows are BIG long. goldman, ray dalio, charlie munger, hsbc have ALL doubled down and MAX longed this baba dip (they have opertaions in china & relationship with government hence baba risk is over played.
short interest remains low at 2%

BABA - It's getting hotterBABA has broken through the major resistance level of 144$/sh, and it seems that next week it might touch the next resistance level at 136$/sh.
There should be quite many people who entered the market at the level of 160-170$/sh, while surely there also enough people who entered the stock at much higher levels, and now might be panicking.
The lower it gets, the better it is eventually, because BABA has no debts and with nearly 1B of users, as one of major representatives of Chinese market, cannot just go bankrupt.
Considering mentioned above, those who entered the stock too high, will need to compensate their losses, by acquiring even more stocks, to balance the average purchase price.
The major question now is, at which level shall we expect to enter the compensating portion - at 140$ or will it eventually get as low as 136$ or even 125$.
Please share your ideas in comments.

Ali Baba crashIf Ali Baba goes down 130$ it can easily crash to 100$ than 87$ and than 60$
just hope is dont goes below 130$ because than its in free fall with no end in see

Alibaba - traders losing patience in a tough marketIn an environment where companies like Nvidia and Microsoft are doing everything right, Alibaba (BABA) seems to be headed in the opposite direction. Granted, the investment cases are vastly different, but when you’re hot you’re hot and when you’re not the negative news is heard far more frequently.
When trading it often pays to follow the flow of capital, and in this case, momentum seems to be the best strategy. Buying strong, selling weak can be beneficial to balance the odds in one’s favour.
BABA is in this camp where bad news has followed the trend lower. Given the slowdown in China’s retail sales and consumption data it's perhaps not a huge surprise that Q2 22 total revenue missed consensus expectations by around 3%. Granted, total revenues did grow 29% YoY but expectations had already been lowered into this earnings report, so the bar to beat was quite low.
In this market, investors are drawn to companies that are consistently beating expectations. BABA isn’t one of them…at least at this stage.
CMR (Customer management revenue) and commission revenue growth of 3% missed consensus, but this was largely a result of soft gross merchandise volume (GMV), which of course is linked to China’s macro backdrop and economic trends. If the share price is going to reverse and trend higher, we need to see signs of consumption picking up. At this stage, the view is we see CMR growing a modest 4-5% in 2H22.
With all these factors at play, perhaps the most pertinent point was that BABA revised its FY2022 revenue guidance to +20-23% YoY, which implies sales will be between Rmb860b-882b - well below consensus expectations of Rmb910.
So, while there were aspects in the numbers to like, on the whole, this was a very disappointing result and the market dumped the stock hard, closing -11.1% - the biggest 1 day fall this year and the second-biggest decline since listing.
Volume was also large, with 61.57m shares traded, over three times the 15-day average. It feels likely that in the session ahead we should see another day of solid volumes, and generally speaking, if I was going to buy this pullback with any real belief, I’d like a couple of days of falling volumes to know the liquidation is done.
Technically, there is not much to inspire the bulls with BABA trading through the 50-day MA and into $141.89, before finding support ahead of the October lows of $138.43. If we see a closing lower low and I’d expect short selling activity to pick up with the stock targeting $118.
BABA is fundamentally cheap
Fundamentally we could argue that even after this downgrade that BABA is trading at a compelling valuation – at 2.29x price to 2022 sales, or 13.9x 2022 earnings one can understand why 55/60 analysts who cover BABA have a ‘buy’ rating on the stock – most would argue this valuation is not representative of the value in its cloud and international business.
BABA’s core commerce business does account for half of the valuation though, and as mentioned, if the stock is going to turn around and head to $228 (the consensus 12-month price target) we’re going to need to see the macro picture in China turn around, consumption to kick up and some of the huge investments made by BABA start to feed into the bottom line.
What will traders potentially do?
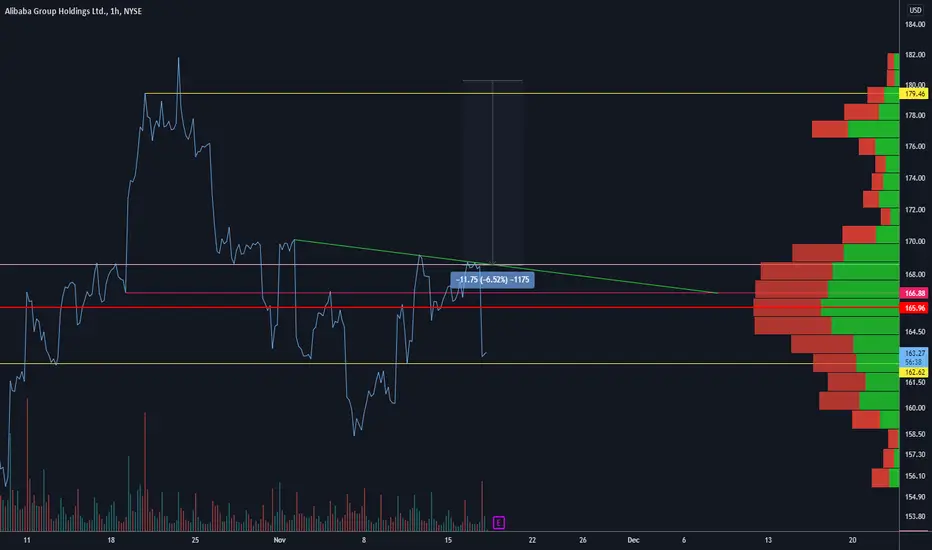
For now, we may say this is fundamentally cheap, but with the stock likely in the doghouse in the near term, until we see evidence of a turnaround the trading capital will likely sell rallies into $161.13 (to close the gap) or go outright short on a closing break of $138.43.

Is Alibaba era over ? I think not !So, Alibaba missed its earnings and profits ?
It's one day revenue on Singles day already raked in US$84.54 billion compared to its 31.4 billion revenue for the quarter. Combine Black Friday and Cyber Monday, Amazon's sales pale in comparison with Alibaba. Not forgetting, it's cloud computing business is growing leaps and bounds, 33% to be exact YOY to 20 billion revenue. Yes, it is true that Alibaba cloud business is still within its domestic market and is still far behind Amazon's over 30% global dominance in the cloud space. The 2nd biggest global player is Microsoft so looks like Alibaba has lots of catch up to do in this space.
Yes, the Central government moves is hard to predict and nobody knows for certain if this current price has hit the bottom. But as long term investors, we buy into the growth story of the company and not let short term fluctuations affect us too much.
Here, we understand clearly that Amazon has admitted defeat to Alibaba and other local players in the e-commerce space in China. Think Ebay, Walmart.... the fate is all the same (can you see the pattern). Just because they do well in US or Europe, it does not mean they can thrive or survive in China. They have not done extensive research to understand the Chinese buyers.
E-commerce is 2 dimensional as they said and live commerce which has taken the retail scene to a whole new level in China is raking in explosive sales. Read this article .
So, I will be adding more shares here with this 11% discount from Mr Market. Remember, Mr Market is irrational and can remain so for a long time. Just look at the crypto market and you will know.

BABA - 2nd big fall of the year 2021So it did collapse around 25%, as soon as Earnings were pre-published.
It has nearly reached its earlier minimum of the year and currently stopped at $144/sh.
Although I'm not seeing any clear technical indicators, showing a possible further decline in stock price, this might not yet be the end of fall.
Bad news about Earnings results may have not yet revealed themselves, so we will keep watching.

My perception of Alibaba's weekly stock chartMy perception of Alibaba's weekly stock chart as follows !
After a five-wave with three continuous shares, it enters a correction in the form of a second wave. This is formed as a flat with a big b wave. maybe just it want to make triangle to ready for powerful third wave .. so buying and maintaining it at prices from $ 140 to $ 150 is extremely attractive
Considering the time of the second wave, , it noted that the third wave is the main continuous wave and has very high goals .. maybe above $ 1500 😁 .. so the long holding stock may not be bad .. though it does bother you a little over time

$BABA earnings analysis*This is not financial advice, so trade at your own risks*
*My team digs deep and finds stocks that are expected to perform well based off multiple confluences*
*Experienced traders understand the uphill battle in timing the market, so instead my team focuses mainly on risk management*
Today my team took a dive into Chinese online and mobile commerce company Alibaba $BABA. It has suffered an immense drop from its 52-week ranged high of $280.61. There are numerous events that factored into this sell-off, but we are not here today to discuss them. Instead we will focus on why $BABA is a hot earnings play for November 18, 2021.
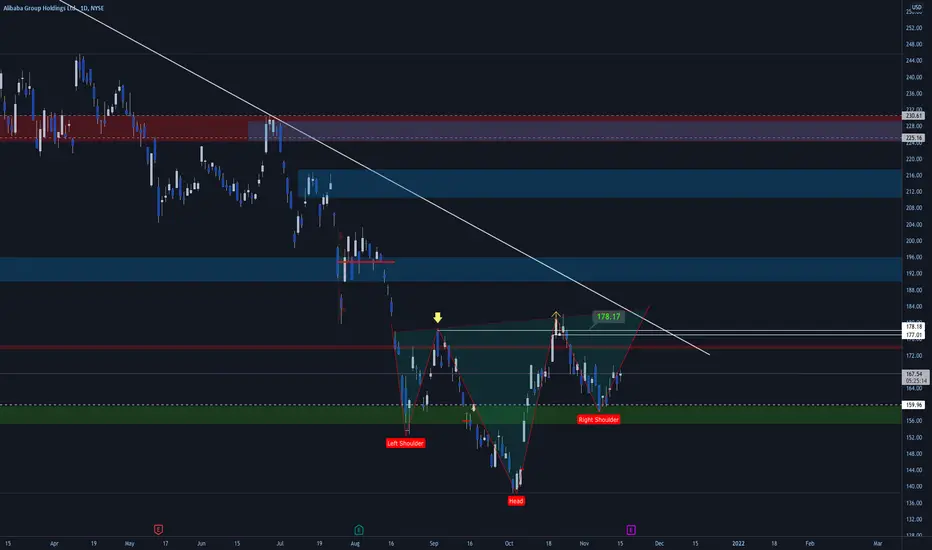
To start, its strong cloud services will likely have shown improvement as they have implemented many new features the past few months to their cloud offerings. This is important because even if they miss earnings tomorrow investors/shareholders may still be encouraged if its cloud strength continues to show progressive results. Another factor that we are fond of is the apparent head and shoulders pattern that is being formed on its chart. This along with a pre-earnings dip of -4% has gotten us very interested in this play.
My team started a long $BABA position today at $161 per share. We will add more shares if a drop occurs, which is possible considering that this is still a fairly risky play.
Our Entry: $161
Take Profit 1: $180
Take Profit 2: $193
If you want to see more, please like and follow us @SimplyShowMeTheMoney

The Ending of an Era - HSIOriginal Chart This is Based Off
2018 update
Original Trade Strategy Around This Chart
Everything should be self explanatory in the chart. Of course - this will work until it doesn't, but since the 1990, the HSI index hitting its upper resistance line has nailed every major global market top within a very short timeframe. You can see how perfect this has timed markets with the correlation to the SPX index in the lower chart. Hypothetically speaking, when you would hit the upper resistance line, you would short emerging markets to hedge against whatever is about to happen. Then when this hits the lower resistance line, you would go long major market indexes until you arrive back at the upper resistance line (SPX, etc).
2022 - End of an Era?
As most can see, this chart is a very very long narrowing wedge / channel. The volatility between drawdowns and rises was far greater the further back you go, and the drawdowns have all been proportionally smaller as we narrow within the channel bouncing off top and bottom resistance (and sometimes in between). With that said, narrowing channels like this indicate increasing fragility of the trend, and potentially suppressed volatility. Eventually, something has to give, and this will break the long term pattern.
I believe we're close to that point, and that's not a good sign for asian markets. I don't know exactly what would happen if this breaks to the downside, but I don't think it would be pretty. Stable systems such as this have a way of becoming extremely chaotic when the stability breaks. Chaotic markets = drawdowns / crashes, and given the current state of Chinese markets and politics, this shouldn't be too surprising that it could be possible. The ongoing Chinese real estate crisis is just getting going, and the party has so far remained committed towards deflating their real estate bubble. Fundamentally, Hong Kong is just as bad if not worse than China from a real estate speculation / valuation perspective, yet there are additional problems in HK with people fleeing the territory due to the Chinese takeover following the 2018 protests. Demographics are strongly against this market, valuations are strongly against this market, and the current economics of this look rather dire without any major positive windows into future development / growth.
From a technical perspective, this is also far weaker than every other time it's hit the bottom resistance line. Note that every other instance we hit the lower resistance line, we also were hitting the lower monthly bollinger band at the same time. Not included within the chart, but momentum indicators also are showing a lot of negative divergences. You can see this from simply looking at the chart and noting the covid recovery bounce has been far weaker than every other post-lower boundary recovery bounce. We didn't even make it up to the middle resistance line before retesting.
My guess and view is that this won't break easily, but it will break dramatically. I think there is a good chance we see another rally here back towards one of the resistance lines, but after that, momentum will have really worn off. I also think we could chop around the lower resistance for a while, but ultimately, we are likely going to break down here on a secular basis. Maybe Kyle Bass will actually be validated after being wrong for 10+ years (except he's probably already been stopped out of all his poorly timed trades)?

$BABA Renko Idea Trying out the renko chart with geomath application, as renko does not included time as a factor ----> (C) 255.50 x 12/15/22

up to ...BABA finished the second wave (correctional) and is now forming the third (impulse). I expect further take-off up to $ 120

BABA - it's time to have a good look at AlibabaAlibaba has reached it's lowest point in a very long time.
PE ratio is not very optimistic, but it may to do with the general situation about Evergrande, which seems going bankrupt very soon.
Aliexpress is reported to have more than 900 million (active) users, while Alibaba has several other businesses along, which act as complementary parts for the whole company and doing in general not bad at all.
My expectations are that BABA will start it rise very soon, unless more negative news about Evergrande will come from China.
In case there will be no bad news, very soon BABA reports earnings, and it will in a way determine how the stock will behave,
Generally speaking, it's about the right time to enter BABA, although the most attractive moment has already passed, when it was trading around 140$/sh in October.
Considering very negative scenarios, when both bad news from China will follow and some other matters, such as interruptions in the supply-chain, I believe it won't fall much lower than 130-140$/sh anyway.
This way, waiting may give the opportunity to gain some extra 10-15% percent, but there won't be much more of it, while entering the stock too late, may eventually lead to more long-term losses.
Let's wait to they Earnings day to see what it will bring...

My Call option Watchlist of the week..!Before starting the analysis I would like to mention option trading is very risky and is not recommended for someone without experience!
For those who have experience, this list could be fun to watch or trade this week!
I usually use high-risk high-reward contracts!
These are my option trading rules!
Please read the rules and apply them to your trading..!
My Option trading rules and strategies
1- Position size: Define your risk level first
A- Small: 3% of Primary Capital
B- Regular: 5% of Primary Capital
C- Big: 8% of Primary Capital
2- Stop Loss:
A: 30% for all positions.(3%,5%,8%,*0.3= 0.9%, 1.5%, 2.4% of your trading capital)
B: Trailing Stop loss will move to Entry piece after 30% profit, for risk-free trades, moves to 20% after 50% and moves to 60% after 100%.
C: No stop loss in the system for the first 30 minutes of the market! ( order Good for Day)
3- Time Frame:
- My optimum goal is to close options trades ASAP, I do not recommend staying in any option trade for more than 72 hours.
4- Buy Naked Calls or Puts
- Buy Calls & Buy Puts options do not bring any obligation, and their risk is limited to losing the premium. I never recommend Sell calls/puts: risk unlimited, Gain limited
5-Strike price
- Only trade first In/Out of money contract. Out-of-money contracts always have higher risks.
- Expiration date
- At least 3-20 days left, But Never keep until the last day!
Closing Target
- will be calculated based on short time swings and will be updated as needed.
- Any change will be announced through notifications.
Best,
Moshkelgosha
DISCLAIMER
I’m not a certified financial planner/advisor, a certified financial analyst, an economist, a CPA, an accountant, or a lawyer. I’m not a finance professional through formal education. The contents on this site are for informational purposes only and do not constitute financial, accounting, or legal advice. I can’t promise that the information shared on my posts is appropriate for you or anyone else. By using this site, you agree to hold me harmless from any ramifications, financial or otherwise, that occur to you as a result of acting on information found on this site.

$BABA POSSIBLE HEAD AND SHOULDers? daily chart, showing bullish momentum lately... ahead of earnings?