Theta Thursday Triggers$NVDA 08/06 205c > 204.50
$TSLA 08/06 745c > 723
$W 08/06 310c > 256
$BABA 08/06 202.5c > 202.40
$SNOW 08/06 280c > 274.50
$FB 08/06 360c > 359.72
Best of Luck!
BABA

BABA: Complete Multiple Time Frame Analysis (H, D and W charts)!Hello traders and investors! Let’s see how BABA is doing today, and do a complete Multi Time Frame Analysis (MTFA).
First, in the 1h chart, we have a pivot point at $ 201.06. This pivot point can change the trend in the short and mid-term for good, if triggered, and it is the first pivot point seen in a while. What’s more, we have a purple trendline connecting the previous bottoms, working as a support too, and we could say we have an Ascending Triangle chart pattern here too.
If we lose the purple line, then probably BABA will keep moving erratically for a while, but what if we trigger the pivot point? Then I see the $ 216.43 as the next target, as evidenced in the hourly chart above, and in the daily chart below:
It seems BABA is inside a Descending Channel in the daily chart, and the $ 216 is the resistance made by the previous tops in the 1h chart, and also by the upper line of the channel, making it a dual-resistance level.
Since BABA hit the lower purple line, it did a Hammer candlestick pattern down there, and we have a pivot point in the 1h chart, the odds are that it’ll seek the $ 216 next.
However, the trend is not bullish yet , as we lack stronger bullish structures around. We only see lower highs/lows in the daily chart, and although the breakout of the pivot point would be a good start (and a high risk/reward buy), the situation is not perfect for BABA.
Let’s see what the weekly chart has to tell us:
Yes, BABA did a fantastic Hammer candlestick pattern, just above the support at $ 189.56 (with high volume, by the way). This is another pattern that confirms our bullish thesis up to the $ 216.
On the other hand, we have another indicator that the $ 216 will be a hard resistance for us to defeat. The 21 ema is at $ 218, and it is dropping each week that passes. This makes the area around the $ 216 a very good top candidate for the mid-term, despite the good bullish signs seen right now.
If you ask me, I’m bullish on BABA, and I see now as a good opportunity to buy, simply because of the good Risk/Reward ratio , but we got be careful with the next resistances, as the trend is not truly reversed yet.
If you liked this idea, remember to follow me to keep in touch with my daily studies, and support this idea if it helped you!
Thank you very much!

BABA taking a look at the weekly chartCritical area, BABA fell from a top of 320$ to 180$, almost a 50% decline when every major investor entered between 220$-250$.

$BABA Earnings week and Chinese volatility (Fibonacci edition)Hello my children of the night!!!
I dunno, just trying stuff out. Anyway, moving on...
$AMZON missed earnings and tanked last week. I'm betting $BABA will do the same this Tuesday, especially given the uncertainty around Chinese stocks and regulation.
I used trend-based Fib retracement and extensions to guide my projection, and of course, my patented "Marijuana Cloud" method foreshadows the pre-ER run up, followed by the post-ER dump.
What do you think? Kiss 200 before dump to 180?
Let me know in the comments below, my children of the night!
Still weird? Okay. Sorry. Just wanted to make sure.
Bye.


Earnings Week (08/02-08/06): Move Predictions, IV CrushBelow I've posted a compiled spreadsheet (Google Drive spreadsheet), outlining a large portion of upcoming earning releases for the week of August 2 through August 6, 2021. Options market overestimation percentages, predicted/actual earnings release moves, and average implied volatility (IV) numbers have all been sourced from Market Chameleon ( marketchameleon.com ).
Google Drive spreadsheet public link: docs.google.com
If and where I've posted quarterly analyst revision numbers, that data has been sourced from Seeking Alpha ( seekingalpha.com ). PLEASE take any analyst "recommendations" with a literal kilogram of salt, as any/all critical thinkers have noted a tendency toward foul play with "analyst" target numbers and recommendations (hint, they do not have YOUR best interests in mind).
Current prices are obviously as of market close, Friday, 07/30/2021. The most important data provided lie in the first five columns immediately proceeding "Current Price."
This spreadsheet provides a readily accessible, macro view of potential earnings plays for the week. I often use this overview to aid with decisions to either buy or write put/call spreads, credit/debit iron condors, or more standard long plays with protective puts, dependent upon overall market volatility (VIX), and equity-specific IV.
Please post any comments/questions/concerns, and best of luck this busy week traders.
NASDAQ:NXPI
RIG
SPG
NYSE:BABA
NYSE:BP
COP
UA
LLY
CLX
ATVI
OXY
AYX
CPE
CVS
SMG
CLVS
MPC
ROKU
UBER
ETSY
FSLY
MPC
WDC
WYNN
QRVO
MRNA
FVRR
W
REGN
SQ
NET
ZG
NVAX
DKNG
CGC
GT
NASDAQ:CRON


Hella Bullish Reversal Hammer on Weekly (BABA)(Opinion Only - but earnings is next week and the cheapest it's been in forever)

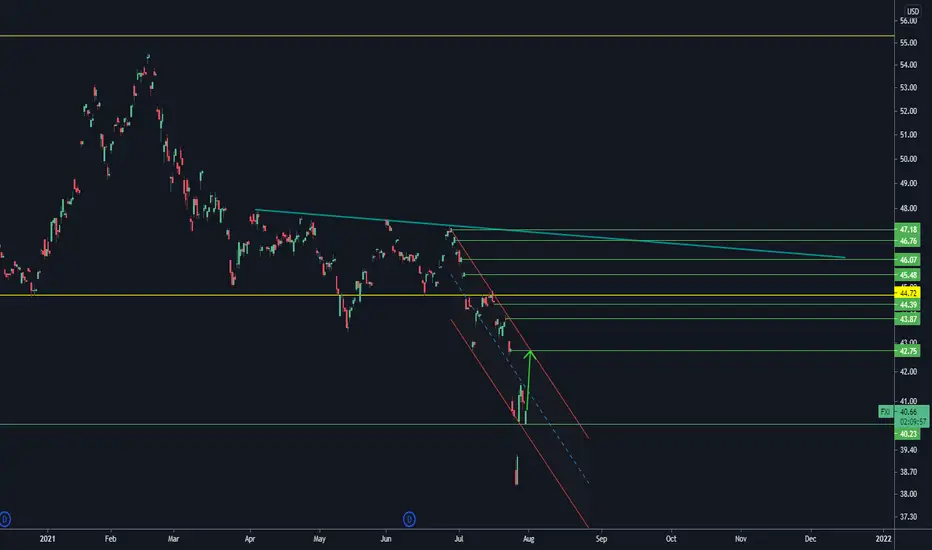
Watching Chinese Names and ETFs - FXI $42 Early Next Week?BABA reports next week 8/3;
likely gives a catalyst for a move up to $210-220 for BABA and then a move for FXI to $42ish
(Opinion only)
BABA case study: Resolution of 200 days correctionToday we want to share our conclusions about the resolution of huge corrective patterns on BABA. One of the key aspects of Technical Analysis is to take advantage of anomalies in historical data; in other words, take advantage of situations that present some degree of repetitiveness to create a probabilistic scenario in our favor, where risking our money is worth.
In this case, we observe that after 200 days of correction, there is a specific sequence for bullish continuation movements.
1) Breakout of the structure
2) Clear Throwback (retest of broken structure) another characteristic is that the correction is very steep
3) The breakout of that correction represents a great opportunity in terms of risk-reward ratio if we set our stop loss below that pattern
Past behavior is no guarantee of future behavior, and bla bla bla.... That's absolutely true; however, if you are not in favor of the Efficient Market Hypothesis, you can see that there are subtle patterns in price data that we can take advantage of, not by saying, "This or that will happen, but by trying to get exposure to a specific pattern several times (taking the same trade 10 times), that way we can start observing an edge.
So, final conclusion in this case study: Now, we will comfortably sit in our chairs, and we will not do anything until the filter we have defined happens. If that's the case, we know exactly how we will trade. If the filter does not happen, guest what... We don't trade; there are more than 2000 stocks that you can wait for a BEAUTIFUL and PREMIUM scenario.
Thanks for reading!

BABA LONGWanted to see how the market reacted today - yes missed the spike tomorrow, but given i'm not the biggest BABA fan played this one abit safer.
Indicators looks good today - potential returns look good - will DCA as per strategy.
** NOT TRADING ADVICE **

A butterfly flapping its wings can cause a hurricane in China!You don't need to see an Optometrist, and you did not drink an excessive amount of alcohol, at least I did not, however, I am not sure about you..!
There is nothing wrong with you if you see BABA , PDD , JD , NASDAQ:BIDU creates the exact same pattern..!
This could be explained in mathematics!
What is Chaos Theory?
Chaos is the science of surprises, of the nonlinear and the unpredictable. It teaches us to expect the unexpected. While most traditional science deals with supposedly predictable phenomena like gravity, electricity, or chemical reactions, Chaos Theory deals with nonlinear things that are effectively impossible to predict or control, like turbulence, weather, the stock market , our brain states, and so on. These phenomena are often described by fractal mathematics, which captures the infinite complexity of nature. Many natural objects exhibit fractal properties, including landscapes, clouds, trees, organs, rivers etc, and many of the systems in which we live exhibit complex, chaotic behavior. Recognizing the chaotic, fractal nature of our world can give us new insight, power, and wisdom. For example, by understanding the complex, chaotic dynamics of the atmosphere, a balloon pilot can “steer” a balloon to a desired location. By understanding that our ecosystems, our social systems, and our economic systems are interconnected, we can hope to avoid actions which may end up being detrimental to our long-term well-being.
Chaos Theory
Chaos theory is concerned with unpredictable courses of events. The irregular and unpredictable time evolution of many nonlinear and complex linear systems has been named chaos. Chaos is best illustrated by Lorentz’s famous butterfly effect: the notion that a butterfly stirring the air in Hong Kong today can transform storm systems in New York next month. The definition of deterministic chaos implies that our prediction in the form of a model, for instance, is very sensitive to the initial conditions. The difference between predictions with slightly different initial conditions grows exponentially:
d(t)=d(0)eat*
where d(t) is the difference between the two predictions at time t and d(0) at time zero, t is the time, and a is a positive number.
*at: is the power of e, I do not know how to type power in TradingView..!
Chaos theory, more technically nonlinear dynamical systems (NLDS) theory, is an exciting, rapidly developing area of mathematics with increasing application in the physical, biological, and social sciences. Along with the great metaphorical appeal, nonlinear dynamical systems can also add rigor and realism to human sciences; they may help illuminate creativity, an elusive, sometimes near-magical phenomenon that has defied simple explanations. Chaotic or near-chaotic systems can demonstrate surprising flexibility and adaptability. Despite connotations of ‘chaos,’ they also demonstrate order, complexity, and self-organization. Some relatively simple, mechanistic, completely deterministic systems are capable of surprising, discontinuous, and seemingly unpredictable change.
Challenged by Instability and Complexity
Challenged by Instability and Complexity…
Jan C. Schmidt, in Philosophy of Complex Systems, 2011
1 Introduction: the Stability Assumption Is Unstable …
Nonlinear Dynamics — including Complex Systems Theory, Chaos Theory, Synergetics, Dissipative Structures, Fractal Geometry, and Catastrophe Theory — is a young and fascinating field of scientific inquiry that spans many established disciplines (cf. ). However, it poses challenging problems for both scientific methodology and the philosophy of science. Methodological prerequisites as well as metaphysical assumptions are questioned, e.g., predictability, reproducibility, testability, explainability as well as lawlikeness (determinism/causation). The common denominator of all of these challenges is instability — that is the main thesis of this paper.
Since the advent of Nonlinear Dynamics and its advancement in the realm of physics in the 1960s — interlaced with methodological developments in computer technology and the computer's ability to numerically handle nonlinearity — further evidence for the existence and prevalence of unstable and complex phenomena in the physical world has emerged. Nonlinear systems, even those with just a few degrees of freedom, can exhibit static, dynamical and structural instabilities. Although instabilities call implicit metaphysical-methodological convictions and well-established underlying prerequisites of mathematical science into question, today they are not viewed in just a negative way. On the contrary, instabilities are highly valued — we find a positivization of instabilities: instabilities constitute the nomological nucleus of self-organization, pattern formation, growth processes, phase transitions and, also, the arrow of time (cf. ). Without instability, there is no complexity and no change. The phenomena generated by underlying instabilities in nature, technology and society are manifest; we can observe these phenomena with our unaided senses. In fact, instability is the root of many homely phenomena in our day-to-day experience — for example, the onset of dripping from a tap or water freezing to ice in a refrigerator. Instability has to be regarded as an empirical fact of our life-world and beyond — not just as a contingent convention.
A reconsideration of the traditional methodological-metaphysical stability assumptions therefore seems to be indispensable. (a) In the past, stability was taken for granted as an implicit a priori condition to qualify a mathematical model as physically relevant or adequate. Stability seemed to be a key element underlying any kind of physical methodology: it was regarded as the sole possibility to guarantee the application of methods of approximation and, also, to deal with empirical and experimental uncertainties. (b) In addition to methodology, an underlying metaphysical conviction was pervasive throughout the history of physics, guiding the focus of interest and selecting the objects that were considered worth researching. Framing and conceptualizing nature as “nature” insofar as it is stable, time-invariant and symmetrical (metaphysics), was indeed a successful strategy to advance a specific physical knowledge (methodology). It is interesting to see that metaphysical convictions and methodological considerations are interlaced; there is no clear line between metaphysics and methodology, as will be shown in this paper.
Throughout history, stability metaphysics has always played a major role in science, beginning in ancient times with Plato's stability concept of the cosmos. In modern times, stability metaphysics can be found in the works of outstanding physicists such as Newton and Einstein. For instance, in his Opticks Newton did not trust his own nonlinear equations for three- and n-body systems which can potentially exhibit unstable solutions . He required God's frequent supernatural intervention in order to stabilize the solar system. In the same vein, Einstein introduced ad hoc — without any empirical evidence or physical justification — the cosmological constant in the framework of General Relativity in order to guarantee a static and stable cosmos, “Einstein's cosmos” . Both examples, from Newton and Einstein, illustrate that metaphysical convictions — what nature is! — can be incredibly strong, even if they are in conflict with what is known about nature at the time.
Today, however, ex post and thanks to the advancement of Nonlinear Dynamics, we can identify a “dogma of stability” that has determined the selection (or construction) of both the objects and the models/theories in physics. “We shall question the conventional wisdom that stability is an essential property for models of physical systems. The logic which supports the stability dogma is faulty.” : the stability assumption is itself unstable! Although the discovery history of instabilities traces back to physicists such as Newton, Laplace, Stokes, Maxwell, Poincaré and Duhem, physical objects were (and often still are) perceived and framed from the perspective of stability — even by the pioneers of instabilities. Throughout the history of exact sciences, instabilities were not acknowledged by the scientific community. This has been changing since the 1960s when physics began widening its methodological horizon — including getting rid of the restriction of methodology to stability requirements. The need to advance physical methodology emerged because instabilities have turned out to be so very fundamental in nature, technology, and even in social processes. In order to deal with instabilities, physicists have over the last 30 years successfully replaced the traditional quantitative, metrically oriented stability dogma by weaker, more qualitative topological characteristics. Many models (theories, laws) in Nonlinear Dynamics are unstable, “and we are confident that these are realistic models of corresponding physical systems” .
Nonlinear Dynamics shows that instability is not an epiphenomenon of minor relevance: instabilities are broadly present in our entire world. Discovering and acknowledging instabilities impels both a reconsideration of the metaphysical views that undergird the stability dogma and a revision of the methodological presuppositions. The outline of this paper is as follows: In section 2, I characterize instabilities and distinguish between three kinds of instability. In section 3, I focus on methodological problems and challenges caused by instabilities; the limitations of classical-modern sciences will be discussed. In section 4, I show how present-day physics manages, at least to some degree, to cope with instabilities.
Instabilities cannot be considered as exceptions within a stable world. Rather, it is the other way around: instabilities are the source of complexity, pattern formation and self-organization. This is why instabilities do not only appear in a negative light; a positive understanding emerges and shows challenging future prospects and perspectives for the rapidly progressing field of Nonlinear Dynamics — and beyond: for all mathematical sciences.
My Soul is painted like the wings of a butterfly..!
Moshkelgosha
References :
www.sciencedirect.com
fractalfoundation.org

BABA where to now ? July 28 - baba touched right on the swing low @198 on July 8.
this is a critical resistance point for baba. lets see if it can clear out of 215.
As always, wait for a higher high and low in order to go long.
There may be more selling to come.


BABA Buys the Dip 🔺🔺🔺Looking to place some Long Verticals or OutRight Long Calls expiring Dec 2021 on BABA as Chinese Stocks getting slammed hard

$BABA at levels of high value.
Alibaba Group Holding Limited (BABA) , also known as Alibaba Group and Alibaba.com, is a Chinese multinational technology company specializing in e-commerce, retail, Internet, and technology.
It is currently at prices from 2017-2018 and pre-Covid. It has retraced about 45% from its record high which puts it in a deep bear market. Current Fair Value , according to DCF, is $301.
The Technicals show the following:
1) Bollinger Bands show that it is overextended to the downside by 3 standard deviations.
2) The Volume Profile , which measures volume by PRICE , shows that since its IPO, this price level here is where the most VOLUME comes in. This can be translated to, these levels here is were investors find value in the stock.
3) The RSI on the Daily show that it is grossly oversold.
Buying China Stocks here will require mental strength as bad news continues to circulate the Media. This can be compared to the Covid Crash of 2020 where the market took a tumble and the media made retail feel as if the market had no bottom. At the levels that most retail sold was actually the levels to buy. Famous words by the great Warren Buffett when he says "Be fearful when others are greedy, and greedy when others are fearful." Chinese stocks have been in a bear market for over 8 months while companies like Alibaba continue to bring in Billions of dollars in revenue.
We must learn that a stock price does not always reflect the value of a company; it is our job as investors to look for and find that value in the market. For now, it seems as if the long term value is here in Alibaba.

ALIBABA - Saw support at $180-Shares of Chinese e-commerce giant Alibaba Group Holding (NYSE:BABA) dropped 4% as of 10 a.m. EDT Monday, and given the headlines coming out of China last week regarding how the government is cracking down on tech companies left and right, this is not too surprising.
-As The Wall Street Journal reported over the weekend, the Chinese government is pressing tech giants Tencent Holdings (OTC:TCEHY) and Alibaba affiliate company Ant Group to help it develop a new "state-backed digital currency" -- i.e., a cryptocurrency -- to be dubbed the e-CNY (or electronic Chinese yuan).
-This is bad news for Alibaba because Ant operates the Alipay digital payments network already, and the emergence of a competing e-CNY brings "the risk of eroding the huge user base" that Alibaba and its affiliates have built up over the past decade.
-All of these negative effects dropped the price of BABA greatly. Now that we had enormous amount of drop in this stock, time is to buy it from the dips. This entry ofcourse is suggested for long-term investors rather than the short ones as the state of Chinese stocks and Baba is still under some pressure.

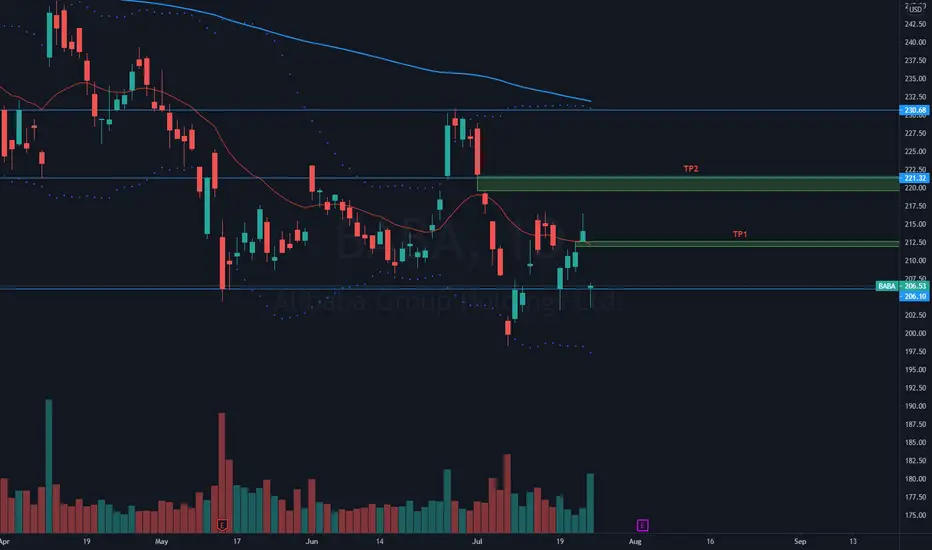
Long | BABA | Swing TradeNYSE:BABA
Possible Scenario: LONG
Evidence: Price Action, Money-Flow, Reversal candlestick with high volume rejection
TP defined on the chart.
Call options 09/17/2021 Strike 220$
*This is my idea and could be wrong 100%, not a BUY/SELL/HOLD signal.

WATCHING $BABA for @ 198.52 WATCHING $BABA for @ 198.52
Little shooting star candle too might just push it there... 💫
————
I will repost when it get’s closer (or if I take a position)if it goes that way and if it makes higher highs I’ll repost with new entry.

Alibaba (Falling Wedge)I bought a week ago at $212. I plan on picking up more shares if it hits $200. My price target is $300.

$BABA could drop further BABA could drop further tonight. Using time analysis, the down wave took 10 days and the recent retracement took 5 days and it touched short of the 50% retracement.
down target is 180.
