BABA - Long Term EntrySimilar drops in red, the first and the third are the most comparable
The third drop has pushed price down, right back to the first drop point
A new cycle should proceed, as this pattern sequence completes itself
Babalong

IS ALIBABA FOR SHORT OR BUYhello friend its a probability if you understand price go with small qty.....

WEEKLY ANALYSIS ON ALIBABA STOCK hello friend lets see how we should plan on this stock for this week market is look like positive or what??

ALIBABA WEEKLY ANALYSIS #alibaba weekly analysis where market bottom is how we need to plan for this week

alibaba for short or what?????hello friend make sure you stick to the SL its volatile stock can be go down if risk to reword suit you then go with small qty

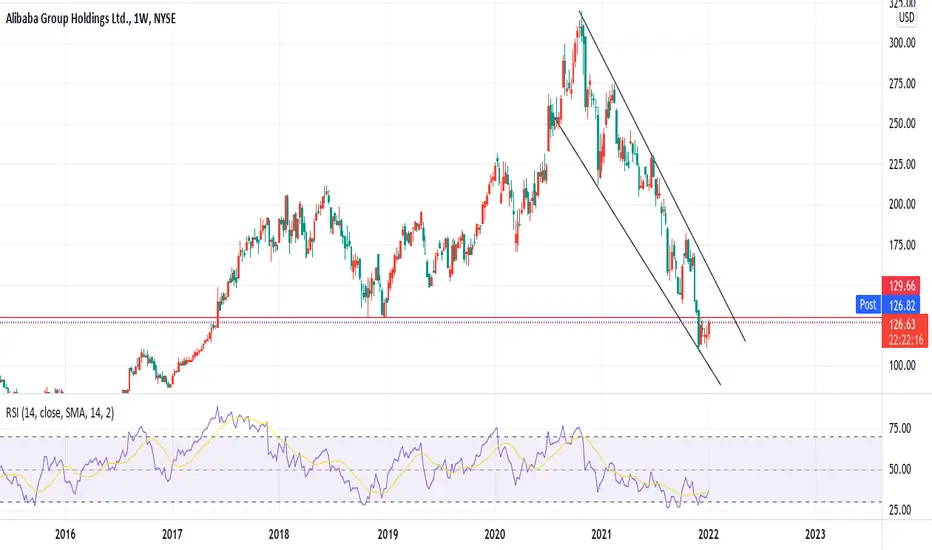
👽 ALIBABA. ACCUMULATION HAS BEGUN. NOT SO FAST!Hello everyone. Today Lets take a look at Alibaba 1W Chart. What do we see?
1. First of all, currently we are in descending channel , there is no rally that changes the behaviour (from bearish to bullish ) yet. Thats a fact.
2. Recently we saw good 1w bar with big massive spread and climactic volume . What does it mean? This might be a zone where Composite Operators will be accumulating the stock. Also that doesnt mean that we will see bigger prices immiediately because of climactic action and lack of deep tests of this bar - points of fear (a lot of weak hands heared on news, from different public traders that "we have found bottom, lets buy that!")
3. Currently we are waiting for some tests of this bar. No one can tell you where we will found 100% stopping action and support of next accumulation (at which level), we just might predict that. So our first interesting zone to stop downmove is 104-105$ (0.382 fibonacci zone), second is 99-100% (0.5 fibonacci zone), third is 94-95 (0.618 zone). But we should pay more attention to lower timeframes in order to claim the end of local bearish reaction (1d, 4h timeframes). If we see shortening of thrust on 1d chart, lack of supply, big demand tales and good bullish bar with big spread on low demand volume (not climactic) after those this is a right time to try long! and start accumulating with CO in potential phase B. But accumulation might be very long! So you must not be aggessive and divide your pose into parts and have multiple POE to reduce your risk.
Thank you for reading, write your thoughts down in comment section below.

BABA - Oversold to overbought
Everybody knew 77 was ridiculous level for this name to see when eCommerce was booming WW. But when the risk appears in the percentage terms in front of you...its hard to justify the buy. The core of how the titans of the investing world operate. Value is the most when retails is the most scared to touch anything. This applies to many chinese names. Not all of them will end up making money for the investors, but there are big names that should hold well over the next decade - BIDU, BABA, TECHY to name a few
Despite how much the price has bounced, that can't be your reason to trade. Critical indicators are VMA, 30 EMA and ATR buy zone. If you really believe in the turnaround theory (volume suggests yes), any dip below 112 could be used to build a position. right up to 95 as the first stop loss.

BABA searching for longs we can see BABA bottomed. We can see highest volume since 2015 listing with huge reversal candle. I personally looking for longs

Alibaba group holdings - BuyAfter the big fall since October 2020, the stock could have found a bottom at 73.17, as evidenced by the island reversal candlestick pattern, that was confirmed by an increase in volume with the second gap. Go long with a stop below the 73.17 low for a rebound towards at least 130.00/140.00

BABA Price TargetThe Price Target for BABA Alibaba is $135.
All the Chinese stocks are primed for a strong recovery after China`s top administrative authority said it would work to stabilize the stock market and boost economic growth!
Traders are expecting the Chinese government would support the stock market like the FED did in the US.


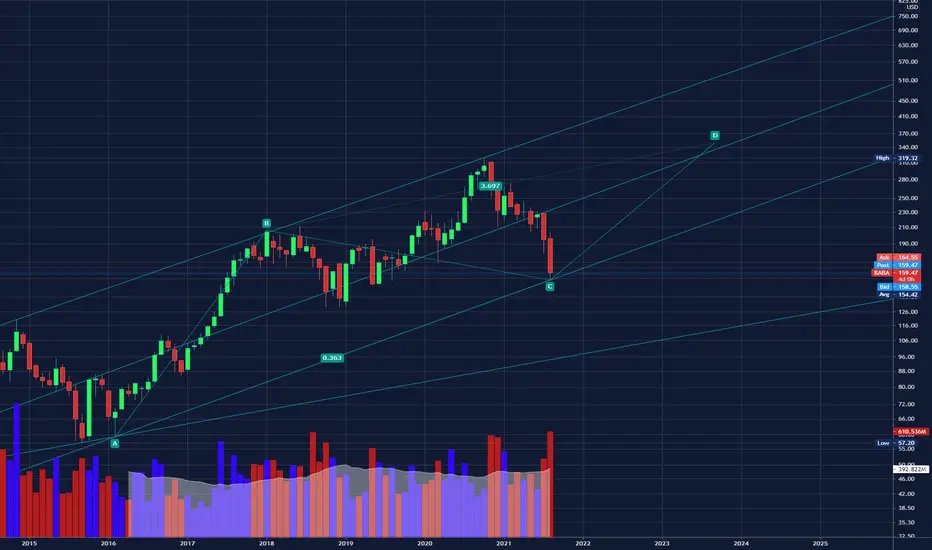
ALIBABA , is gonna ready for end this correction eventually ?A three-wave ascent and then a diagonal drop indicate that we are in a larger scale in a triangle or structure.
+ Personally, my entry strategy is wait for the conflict and corrections of the indexes to end and see a confirmation of the end of the downtrend, and I confidently enter with a heavy volume ... because it has good conditions for entry !
+The analysis is based on the fact that the United States reached a trade agreement with China to prevent its enemies from uniting.

$BABA is under accumulationVCP pattern emerged in this BABA daily chart. Long above 127. Target 138 and above. Mark Minervini is the reference guide to what is a VCP setup.

BABA seems to have found a bottomI see multi-week accumulation from late November and 2016 resistance acting as strong support with bullish divergence on the weekly, what do you see?

Great Long Opportunity on BABA
Great Long Opportunity on NYSE:BABA , but wait and see if VMC green buy indicator keep showing at the end of the month!
Potential 150% gains if BABA reach ATH!
**I think NYSE:BABA is a great mid-long term hold although there is "delisting risk" with the chinese stocks on NYSE**
NYSE:BABA
www.tradingview.com

$BABA trend reversal is near if......we will confirm the reversal of our longe bearish momentum , if we broke our defending line and close above , near the 150$, and of course to confirm that we need to close 4h candle above .

BABA updateGood earnings for alibaba can lead to a monster rally for wave 3. Keep on watch the 20day/50day MA cross. Heres the chart ...
Note : Yesterday HSI broke out of the flag right at 50dayMA... is it the beginning of the china reversal ?...

BABA Bear Pattern Break upBABA has been battling at the 131.5 level on the daily.
It is currently in a long pattern coming from the downside, but has been basing up currently.
Has some resistance overhead around the 138 level, which if broken can target 140, 143, 148 and finally a gap fill to the 160 region.
If BABA can hold the 131.5 close on the daily for the next few days (as well as the overall market and HSI holding up as well!) and if it can break that 138 level. I would target the above ^.
02/18 140c would work with targets as listed above.
Invalid with close < 131.5 on the daily.
Terrible timing with market OPEX coming up and FED tightening of policies. Never fight the FED. If they're hinting at "risk off" then all stocks - no matter the pattern - will sell off.

BABA Good buyBaba after all the news is down 70% and is at higher time frame support.
A good buy for 20% and more targets, Also a good buy for long term.

BABA reversal ?We can see that BABA made a 5 Waves down on daily. BABA recently made the 1-2 to setup for the reversal. We can see a big green candle near demand with the volume validating the move. BABA retraced perfectly to the 0.618 for wave 2. It also broke neutral and 20day MA is reclaimed and curling up.
However, overall its still making higher lows and we don't know if HSI reversed. With all China uncertainty, becareful and manage risk.
Is this the first wave on daily for the reversal or only intra waves for earnings ? Is it the floor ? We don't know but it looks good keep it on watch...

Have Started Buying BABA Here.I don't see this company shutting its doors, stock down 60% and this looks like a solid weekly bottom forming. Low time frames look great also. Not advise archiving thoughts.
BABA - Alibaba Group Holding LtdBullish - Will require patience like my other trades.
( NYSE:BB NASDAQ:TLRY )
Previous Close 165.24
Open 159.99
Bid 159.56 x 800
Ask 159.57 x 800
Day's Range 158.56 - 161.74
52 Week Range 152.80 - 319.32
Volume 30,294,580
Avg. Volume 20,830,984
Market Cap 436.158B
Beta (5Y Monthly) 0.81
PE Ratio (TTM) 19.25
EPS (TTM) 8.28
Earnings Date Nov 03, 2021 - Nov 08, 2021
1y Target Est 1,788.37
NYSE:BABA
CAPITALCOM:BABA
BCBA:BABA
SIX:BABA
MOEX:BABA-RM
SWB:AHLA
CAPITALCOM:9988
BCBA:BABA
OTC:BABAF
FTX:BABAUSD
MYX:ALIBABA-C3
SWB:2RR
BITTREX:BABAUSD
BABAWith monthly - weekly - daily momentum all in oversold territory, BABA is currently sitting just above a crucial support on the weekly chart.
I will be expecting a bounce and spending some time in the highlighted area for a while..
I'm on the long side as it has more probability in my point of view and last weeks close was a gravestone doji. I think we are finding the bottom finally to neutralize the trend.
Peace..
