$BABY Breakout Alert!TSX:BABY chart update:
Symmetrical triangle breakout in action on the 4H chart! 📈
Price has broken above the resistance trendline with solid structure, confirming a classic bullish continuation setup!
🎯 Targets:
• TP1: $0.10575
• TP2: $0.11775
• TP3: $0.13889
📍 Risk-reward is prime with tight invalidation below $0.089.
Let’s ride the momentum — breakout traders, your moment is here!
If you find this analysis helpful, please hit the like button to support my content! Share your thoughts in the comments, and feel free to request any specific chart analysis you’d like to see.
Happy Trading!!
Babypips
📚 The Beauty of Combining Technical & Fundamental Analysis 📚 What is Fundamental Analysis?
Fundamental analysis is a way of looking at the forex market by analysing economic, social, and political forces that may affect currency prices. The idea behind this type of analysis is that if a country's current or future economic outlook is good, its currency should strengthen (Baby Pips - www.babypips.com)
What is Technical Analysis?
Technical analysis is the study of historical price action in order to identify patterns and determine probabilities of future movements in the market through the use of technical studies, indicators, and other analysis tools (Forex.com www.forex.com)
Technical analysts look for similar patterns that have formed in the past and will form trade ideas believing that price could possibly act the same way that it did before.
From the chart above, you can see how key fundamental news created incredible volatility in the market but the underlying technical analysis was still intact. From this, we can gather that although fundamental analysis is important, technical analysis is just as important.
See charts below to identify how we could have traded the key fundamental moments over the past few years.
See links below for more trade ideas and in-depth analysis!
NZDUSD my view on this pair remain the same as we are in wave 4 , if this is expanding flat then we will have a push up to 0.6620 and price will go down more below 0.6384 to complete wave C of the structure but as for now im still in for the sell unless the previous high is broken to confirmed the expanding flat .
Fibonacci Retracements- USDJPY sell limit I'm synchronizing this to my babypips lessons gotta start somewhere #gang trying to get this "hands on" training. So I learned about fibonacci retracements and I'm placing a sell limit order: assuming that the overall downtrend continues, as seen in the 4 hour chart for USDJPY, if the retracement rallies above the 23.6 % level my order (position=sell) initiates. I set a tight stop loss in case the downtrend does not continue. The take profit is very generous to accomodate for the potential downtrend. I am chasing the #trend #gang
EUR/USD Exchange RateEUR/USD Exchange Rate
Once you start getting used to the signs of breakouts, you’ll be able to spot good potential trades fairly quickly.
Breakouts are significant because they indicate a change in the supply and demand of the currency pair you are trading.
This change in sentiment can cause extensive moves that provide excellent opportunities for you to grab some pips.
This indicator will show Support & Resistance Levels for the trading strategies with the current level clearly highlighting possible price turning points or breakouts for price action trading.
EUR/USD's decline extends to as low as 1.0793 so far and broke 161.8% projection of 1.1172 to 1.0992 from 1.1095 at 1.0804.
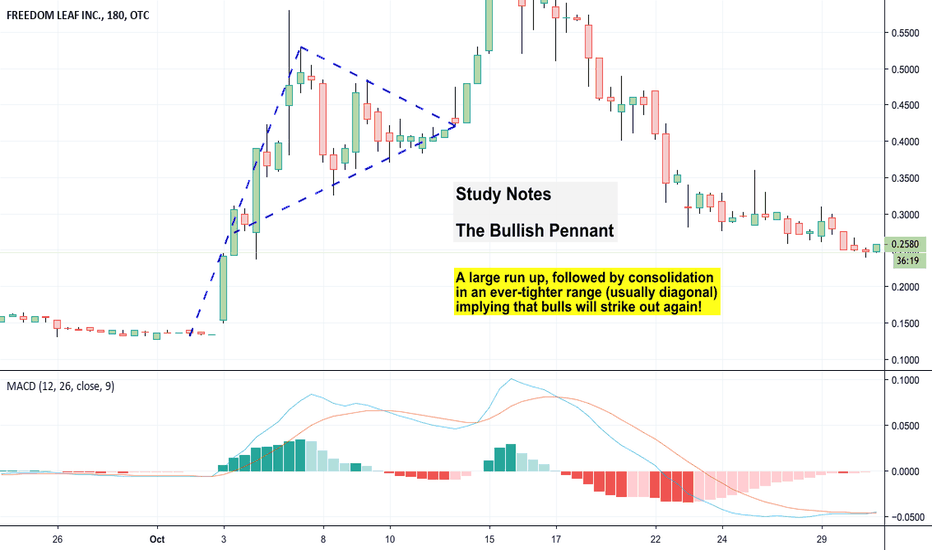
Study Notes - The Bullish PennantStudy notes based on the Babypips course.
Based on this article:
www.babypips.com
Bullish pennants are formed in an uptrend and imply that the bulls are about to charge again!
- Uptrend
- Breather, consolidation into a tight range
- Breakout to the upside
Flagpole can be used to measure size of the breakout upside potential
Study Notes: Falling WedgeStudy notes on the Babypips course. Based on this article:
www.babypips.com
Chart example: USD/ Swiss Franc
The Falling Wedge is a reversal/continuation signal, much like the Rising Wedge.
In this case:
- During an uptrend, this means momentum is cooling off a bit, but the price will continue to rise later.
- Can be formed at the bottom of a downtrend, meaning that there will soon be upside.
- Placing a long just above the upper line of the wedge would be a good place to get into a trade.
Study Notes: Momentum IndicatorsStudy notes based on Babypips course:
www.babypips.com
Momentum Indicators aka Lagging Indicators
- More accurate in representing changes in trend
- However, lags behind the trend shift, reducing profit margins
- Less prone to false signals / fakeouts so less risky
Delayed entry but higher accuracy. They can still provide some fakeouts especially when price has lowered volatility, or is somewhat rangebound.
Examples: MA's, MACD
Study Notes: OscillatorsI am currently studying the brilliant Babypips.com materials on Technical Analysis.
I'm capturing my study notes on live chart examples.
These are notes from:
www.babypips.com
Takeaways:
- Oscillators are great at giving signal for trend changes
- But they often get ahead of the game and assume *every* fluctuation in momentum is a trend change
- Oscillators fluctuate between buy and sell signals, think of a desktop fan that goes from left-right
Examples:
- Parabolic SAR, Stoch, RSI
My own thoughts:
- Using all oscillators together and looking for 'agreement' might be a nice approach. Charts with decent price history allow you to see how reliable this has been in the past, as a gauge of probability.
- Ichi Clouds is the only indicator that successfully works as a full trading system. You can see these ones have a modest hitrate - only to be used to support a rationale rather than drive it.


